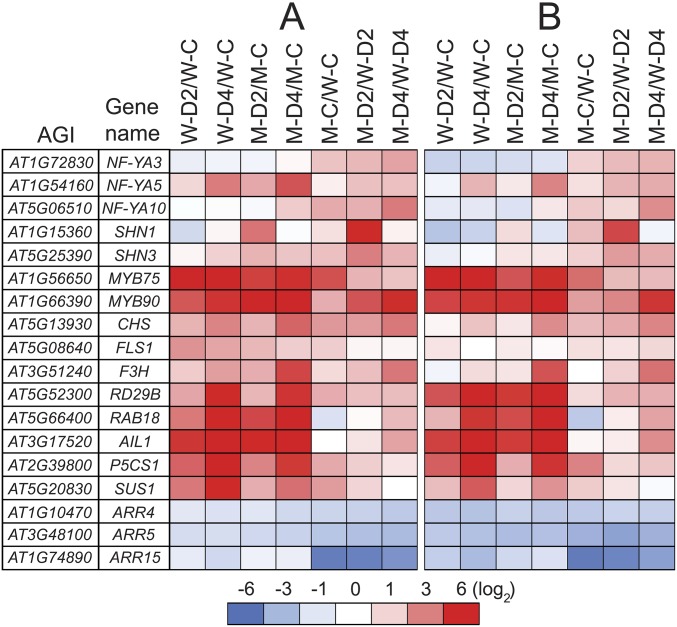
Fig. S7.
Validation of microarray data by RT-qPCR. Expression of selected genes was assessed by RT-qPCR in leaf samples obtained from nonstressed and dehydrated Arabidopsis response regulator arr1,10,12 and WT plants to validate the microarray data. (A) Heatmap presentation of the fold-changes obtained from microarray analysis. (B) Heatmap presentation of the fold-changes obtained by RT-qPCR of three independent biological replicates. UBQ10 was used as reference gene. Changes in transcription abundance are indicated by intensities of colors expressed in log2 scales with saturation at 6. Blue and red colors indicate down- and up-regulation, respectively. W-C, WT well-watered control; W-D2, WT dehydrated 2 h; W-D4, WT dehydrated 4 h; M-C, arr1,10,12 well-watered control; M-D2, arr1,10,12 dehydrated 2 h; M-D4, arr1,10,12 dehydrated 4 h.

