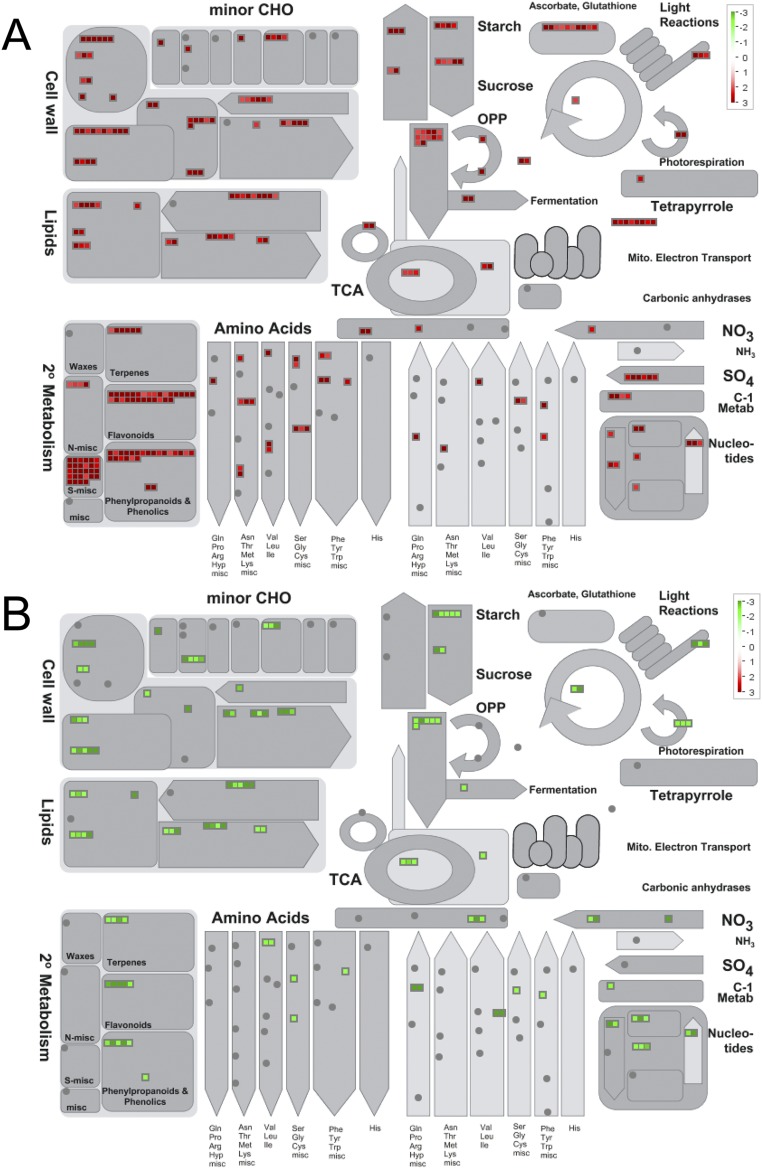
Fig. S8.
MapMan-based illustration of DEGs in M-C/W-C and/or M-D/W-D comparisons involved in different metabolic processes. (A) Up-regulated genes in M-C/W-C and/or M-D/W-D. (B) Down-regulated genes in M-C/W-C and/or M-D/W-D. Green and red colors indicate down- and up-regulation, respectively. Colored bars in each panel indicate fold-changes in gene expression. M-C/W-C, arr1,10,12 well-watered control versus WT well-watered control; M-D/W-D represents M-D2/W-D2 and/or M-D4/W-D4; M-C, arr1,10,12 well-watered control; M-D2, arr1,10,12 dehydrated 2 h; M-D4, arr1,10,12 dehydrated 4 h; W-C, WT well-watered control; W-D2, WT dehydrated 2 h; W-D4, WT dehydrated 4 h. For repetitive genes, their highest fold-change was used in the analysis.

