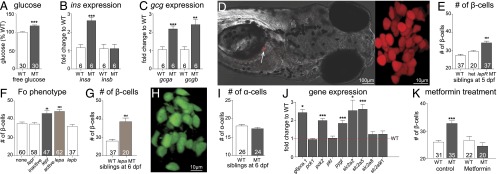
Fig. 3.
Glucose homeostasis phenotypes in normal and leptin receptor mutant larval zebrafish. (A) Whole-body free glucose in WT and leprsa1508/sa1508 mutant in-crosses collected at 6 dpf. A t test shows a significant difference between genotypes, t(58) = 5.179, P < 0.0001. (B) Expression of insa and insb mRNA at 6 dpf, determined by quantitative RT-PCR (qRTPCR). insa shows significant up-regulation t (10) = 6.058, P < 0.001, whereas insb does not t(10) = 0.016, P > 0.05, t tests. (C) Expression of gcga and gcgb mRNA levels, determined by qRTPCR. gcga t(10) = 4.973, P < 0.001 and gcgb t (10) = 4.232, P < 0.01 are up-regulated, t tests. (D) A representative image of a zebrafish carrying the β-cell marker [Tg(1.2ins:H2BmCherry)], and an enlarged image showing individual β-cells. (E) Numbers of β-cells in offspring of an in-cross of heterozygous leprsa1508/+ mutant animals at 5 dpf. Homozygous leprsa1508/sa1508 mutants exhibit a significant increase in β-cell number by one-way ANOVA, F(2, 93) = 18.69, P < 0.001, Bonferroni’s MCT. (F) Number of β-cells in animals at 6 dpf, following injection of embryos with Cas9 and guide RNA directed against lepr, lepa, or lepb genes; ANOVA F(4, 263) = 11.67, P < 0.0001, Bonferroni’s MCT. (G) Number of β-cells is significantly increased in larvae homozygous for a mutation in lepa compared with their WT siblings at 6 dpf. t test t(41) = 4.738, P < 0.001. (H) A representative picture of α-cells in fish carrying the transgene [Tg(gcg:GFP)]. (I) Numbers of α-cells observed in WT and leprsa1508/sa1508 mutant siblings from heterozygous leprsa1508/+ in-crosses at 6 dpf. There was no effect of genotype [t test t(24) = 0.96, P = 0.34]. (J) Data showing gene expression analysis of fry at 6 dpf compared with WT controls. t tests show an up-regulation of glucose 6 phosphatase (g6pca.1; t (9) = 7.059, P < 0.001), mitochondrial phosphoenolpyruvate carboxykinase (pck2; t (9) = 8.601, P < 0.001), liver glycogen phosphorylase [pygl; t(9) = 4.423, P < 0.01], glucose transporters 2 (scl2a2; t (9) = 2.808, P < 0.05) and 5 [slc2a5; t(10) = 5.160, P < 0.001], but not cytoplasmic phosphoenolpyruvate carboxykinase [pck1; t(9) = 0.4822, P > 0.05], liver pyruvate kinase (pklr; t (10) = 0.2263, P > 0.05), glucose transporters 8 [slc2a8; t(10) = 0.903 P > 0.05] or 9 [slc2a9l1; t(10) = 1.31, P > 0.05). (K) Effect of metformin on the developmental increase in β-cell number. Two-factor ANOVA shows an effect of genotype [F(1,107) = 4.785, P < 0.05] and treatment [F(1,107) = 12.56, P < 0.001]. A Bonferroni post test showed a significant elevation in the DMSO-treated leprsa1508/sa1508 mutant group. Data shown as means ± SEM. *P < 0.05; **P < 0.01; ***P < 0.001.

