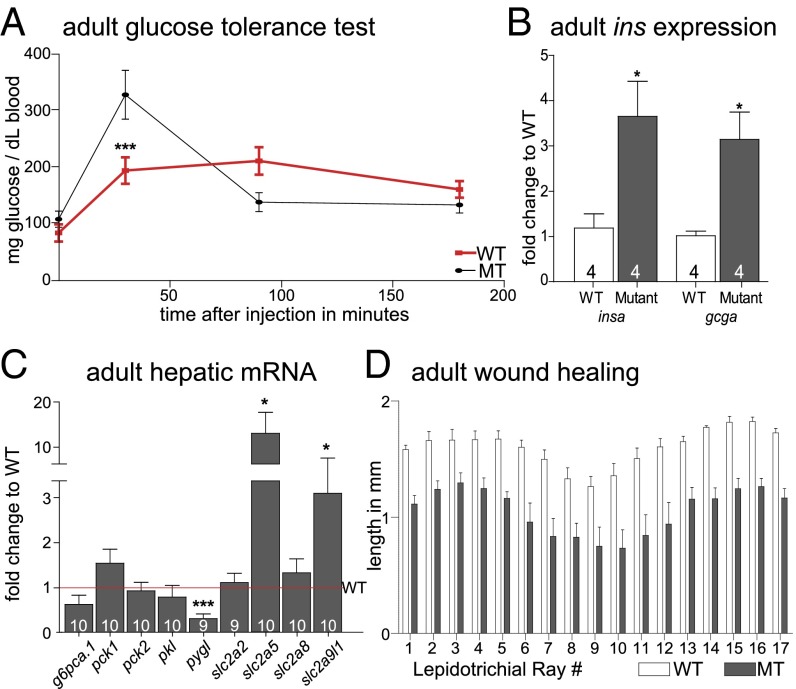
Fig. 4.
Glucose homeostasis phenotypes in normal and leptin receptor mutant adult zebrafish. (A) Glucose tolerance test in 1-y-old WT and homozygous leprsa1508/sa1508 fish. A two-way ANOVA post hoc test shows a significant decrease of blood glucose in homozygous leprsa1508/sa1508 fish at 30 min with a significant interaction between time and genotype [F(3,102) = 7.266, ***P < 0.0001]. (B) insa and gcga mRNA expression in adult visceral samples is increased [insa t(6) = 2.947, *P < 0.05 and gcga t (6) = 3.459, *P < 0.05]. (C) Adult hepatic gene expression analysis shows a down-regulation in liver glycogen phosphorylase [pygl; t (17) = 4.650, ***P < 0.001], and up-regulation in glucose transporters 5 [slc2a5; t (16) = 2.289, *P < 0.05] and 9 [slc2a9l1; t(17) = 2.616, *P < 0.05] and no change in glucose 6 phosphatase [g6pca.1; t(18) = 1.984, P = 0.0627], cytoplasmic phosphoenolpyruvate carboxykinase [pck1; t(17) = 0.3637, P = 0.72], mitochondrial phosphoenolpyruvate carboxykinase [pck2; t(18) = 0.6966, P = 0.49], liver pyruvate kinase [pklr; t(17) = 0.9630, P = 0.35], glucose transporters 2 [scl2a2; t(17) = 0.1563, P = 0.88] or 8 [slc2a8; t(18) = 0.9041 P = 0.38], all t tests. (D) Tissue regeneration 3 d after fin-clipping. A two-way ANOVA shows a significant effect of genotype [F(1, 186) = 169.7, P < 0.0001]. Data shown as means ± SEM.

