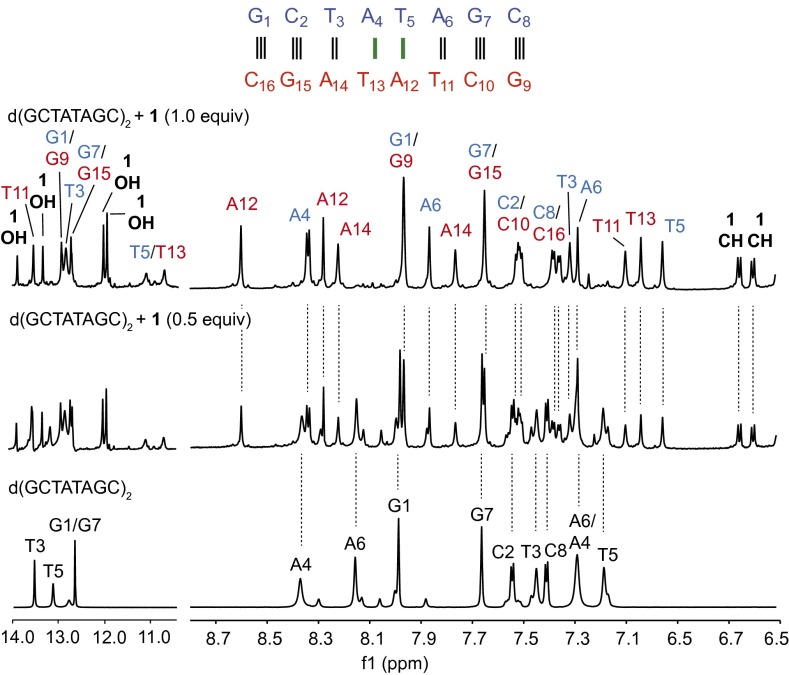
Fig. 3.
Selected regions of the 1H NMR spectrum of d(GCTATAGC)2 and (−)-lomaiviticin A (1; 0, 0.5, or 1 equiv, bottom to top). Green bars denote the site of binding. The 14.0–10.5-ppm spectra were obtained in 10% D2O–90% H2O using the Watergate scheme. The 8.7–6.5-ppm spectra were obtained in phosphate-buffered D2O. Experimental conditions: 10 mM phosphate buffer (pH 7.5), 25 mM sodium chloride, 800 MHz, 24 °C. For additional spectroscopic data, see SI Appendix, Fig. S1.

