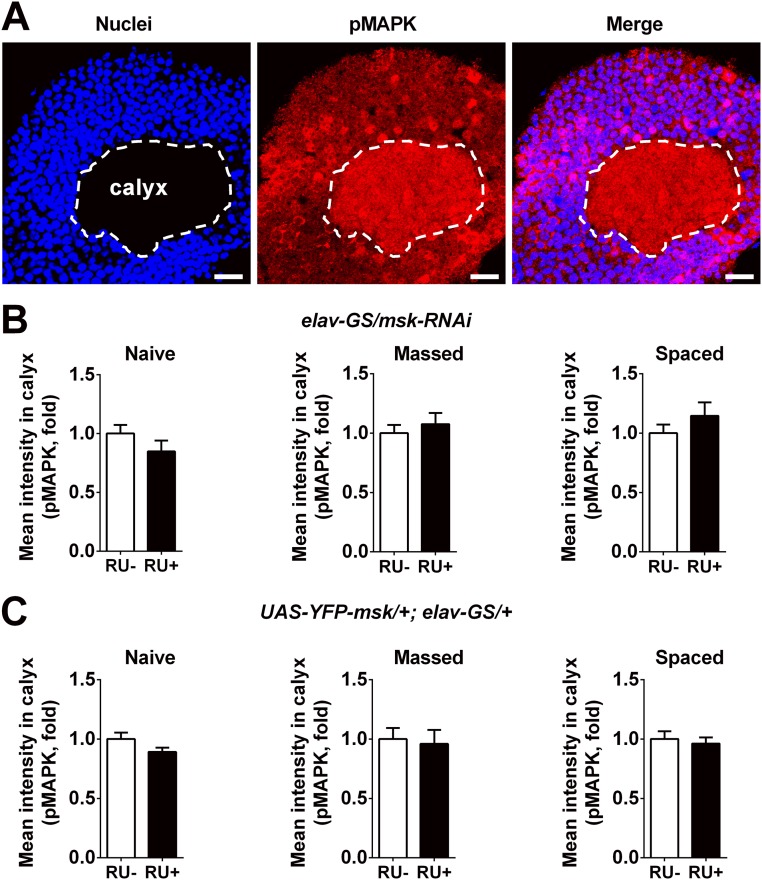
Fig. S5.
DIM-7 does not affect averaged pMAPK intensity in MB calyx. (A) Representative image of pMAPK and nuclei signals in MB. Images include nuclear staining (Left), pMAPK staining (Middle), and merged staining (Right). Calyx, dendritic area of MB, is shown with white dashed lines. (Scale bars, 10 μm.) (B) Statistical analysis of averaged pMAPK intensity in MB calyx of flies with knockdown of DIM-7. Acute expression was induced by RU486 feeding (RU+). No RU486 feeding (RU−) served as control. Data were gotten under different conditions, naive (Left), hour 8 after massed training (Middle) and hour 8 after spaced training (Right). (C) Similar statistical analysis (as in B) of flies with overexpression of YFP-fused DIM-7. Bars, mean ± SEM (n = 7–12).

