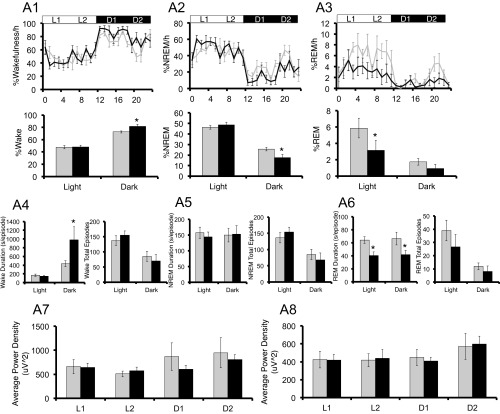
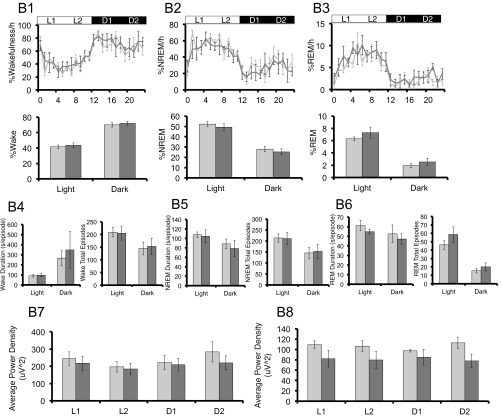
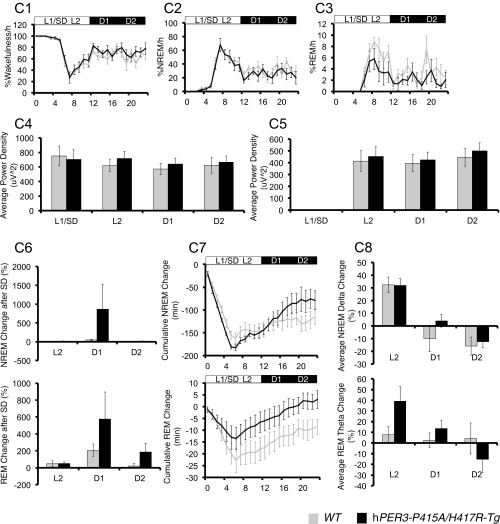
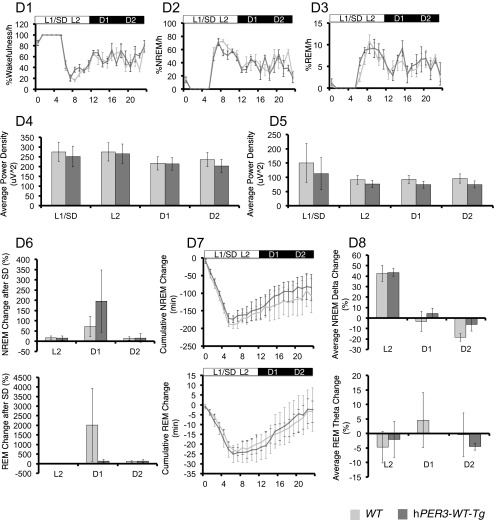
Fig. S4.
hPER3-P415A/H417R-Tg mice exhibit decreased sleep in LD cycles compared with hPER3-WT-Tg and WT mice. EEG analyses for WT (light gray) vs. hPER3-P415A/H417R-Tg (black) mice (A and C) and WT (light gray) vs. hPER3-WT-Tg (dark gray) mice (B and D) were used to quantitate sleep under baseline conditions (A and B) and after sleep deprivation (C and D). (A1 and B1) Percentage of time spent awake. (A2 and B2) Percentage of time spent in NREM sleep. (A3 and B3) Percentage of time spent in REM sleep. Quantification of mean episode duration and number of episodes for (A4 and B4) wakefulness, (A5 and B5) NREM sleep, and (A6 and B6) REM sleep. Average spectral power was calculated for each of the 6-h periods (from left to right: L1, L2, D1, and D2) as indicated by the horizontal bars in (A1–A3 and B1–B3). (A7 and B7) NREM δ and (A8 and B8) REM θ powers were compared for the two genotypes. (C1 and D1) Percentage of time spent awake. (C2 and D2) Percentage of time spent in NREM sleep. (C3 and D3) Percentage of time spent in REM sleep. Average spectral power was calculated for each of the 6-h periods (from left to right: L1/SD, L2, D1, and D2) as indicated by the horizontal bars in C1–C3 and D1–D3. (C4 and D4) NREM δ and (C5 and D5) REM θ powers were compared for the two genotypes. (C6 and D6) Percent changes of time after sleep deprivation compared with the baseline condition for NREM and REM in L2, D1, and D2 for the two genotypes. (C7 and D7) Cumulative NREM and REM sleep loss and gain compared with baseline conditions for the sleep deprivation experiment. (C8 and D8) Analysis of spectral sleep power changes compared with baseline conditions for L2, D1, and D2. Error bars represent SEM (n = 7). *P < 0.05, Student’s t test.


