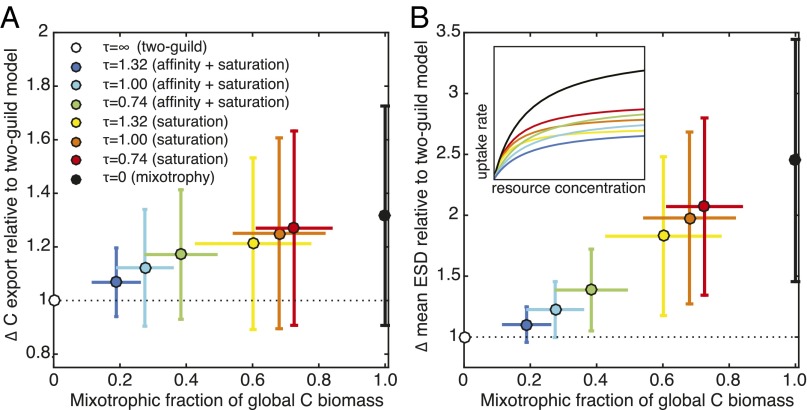
Fig. 5.
Relationship between mixotrophic dominance and the relative increase in global carbon export (A) and global geometric mean plankton size (B) in the sensitivity experiments (Supporting Information), relative to the two-guild model. Dots represent the global average from each simulation, whereas the error bars show the degree of spatial variability in the annual average for each simulation. In the legend, the parameter describes the strength of the tradeoff (a larger number represents a stronger penalty for mixotrophy). This penalty may be applied to the resource affinities and the maximum resource uptake rates (affinity and saturation) or just to the maximum resource uptake rates (saturation) (Supporting Information and ref. 32). The relative uptake functions for the mixotrophs in each experiment are illustrated schematically in B (Inset). With no tradeoff, the mixotrophs have identical uptake functions to the specialists (black line).

