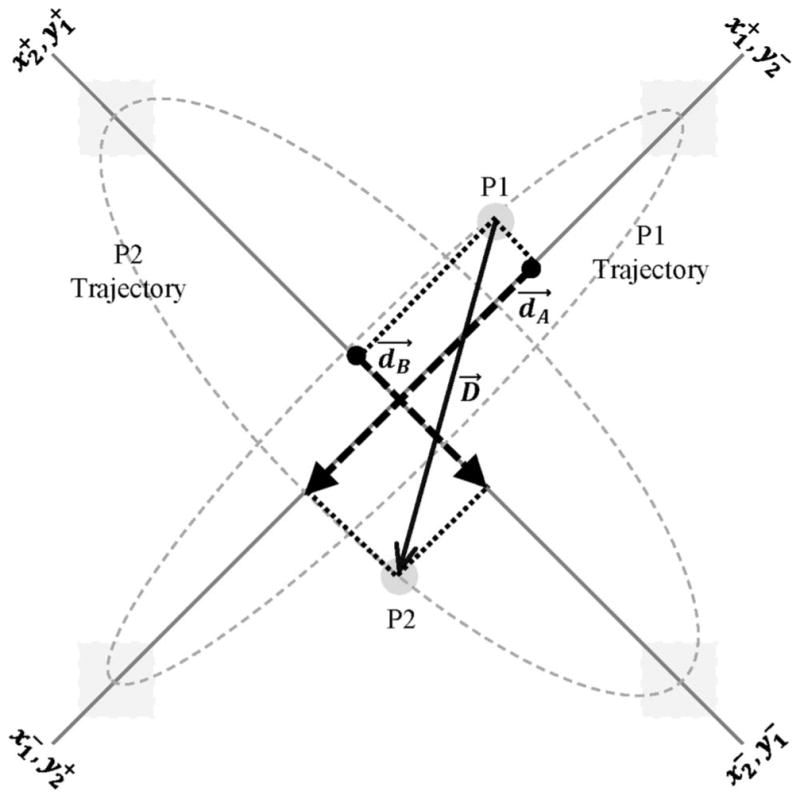
Figure 8.

Illustration of how the displacement vector between participants’ on-screen end-effector locations is projected onto the appropriate task-dynamic axes for defining the repeller coupling functions in Equations 4a–d. The target locations (gray squares) are located at the corners of the screen. The solid gray lines along the screen’s intertarget diagonals represent the primary (limit cycle) task-space motion axes (x1 and x2) and orthogonal (point-attractor) motion axes (y1 and y2) of the participants, P1 and P2. The task axes of P1 are rotated CCW 45° from the screen’s right-horizontal axis, and the task axes of P2 are rotated CCW 135° from the screen’s right-horizontal axis; thus, the labels and at the ends of the intertarget on-screen diagonals denote the positive-going directions for motions along the corresponding xi and yi axes of the ith participant. The gray dashed lines reflect idealized on-screen movement trajectories of the participants, with the gray disks representing the current on-screen locations of P1 and P2 along these movement trajectories. In this example, the solid black line with open arrow heads, D, is the displacement vector from P1 to P2, and the dashed black lines with closed arrow heads, dA and dB, represent the projections of D onto the relevant task axes of P2, that is, dA = y2 − (− x1) = y2 + x1 as in Eq. 4d, and dB = x2 − y1 as in Equation 4b. Note that the displacement vector from P2 to P1 would be represented by −D, and its projections onto the task axes of P1 would be defined by −dA = x1 − (− y2) = x1 + y2 as in Eq. 4a and −dB = y1 − x2 as in Eq. 4c.
