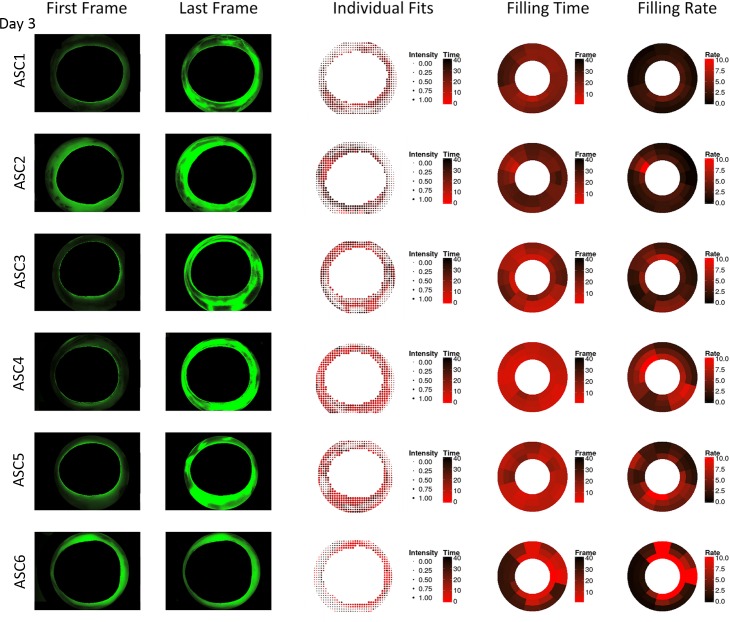
Fig 7. Anterior chamber canalograms on day 3 of culture with improved flow compared to day 1.
Shown are images of the first and final image analyzed (left), quantitative canalography dot plots using individual fits (center), and ring plots illustrating perilimbal aqueous filling time and filling rate (right). ASC = anterior segment cultures, numbered consecutively. All images are rotated to fit the quadrants pattern used in the other figures (SN, IN, IT, ST in clockwise order).

