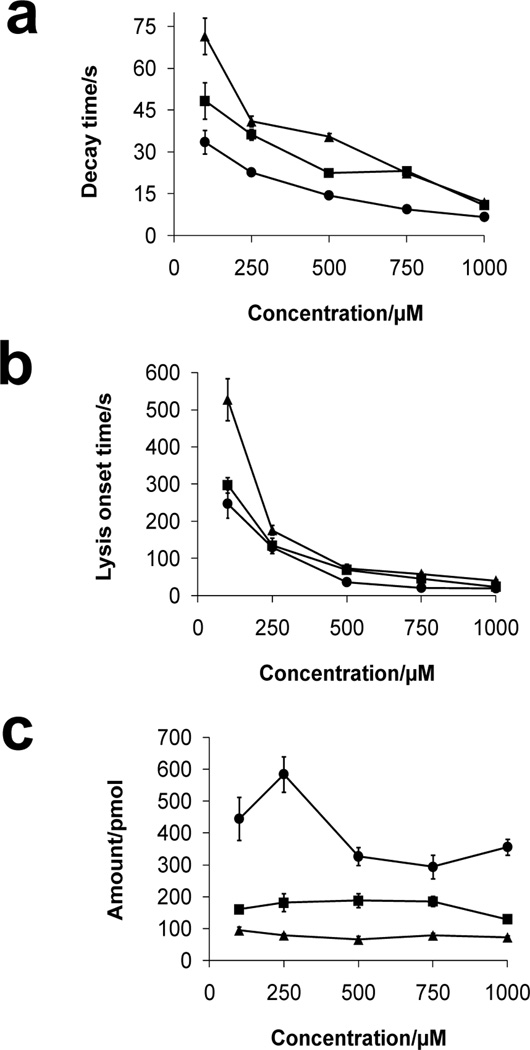
Figure 4.
Plots of (a) decay and (b) lysis onset times of Arcella cells exposed to benzalkonium chloride (100–1000 µM) at flow rates of 5.0 (▲), 15.0 (■), and 50.0 µL min−1 (●). (c) Amount of benzalkonium chloride delivered to cells calculated from lysis onset time at the same flow rates in parts (a) and (b). Values are expressed as mean ± SEM (the number of cells, n, ranges from 17 to 75 for each point).

