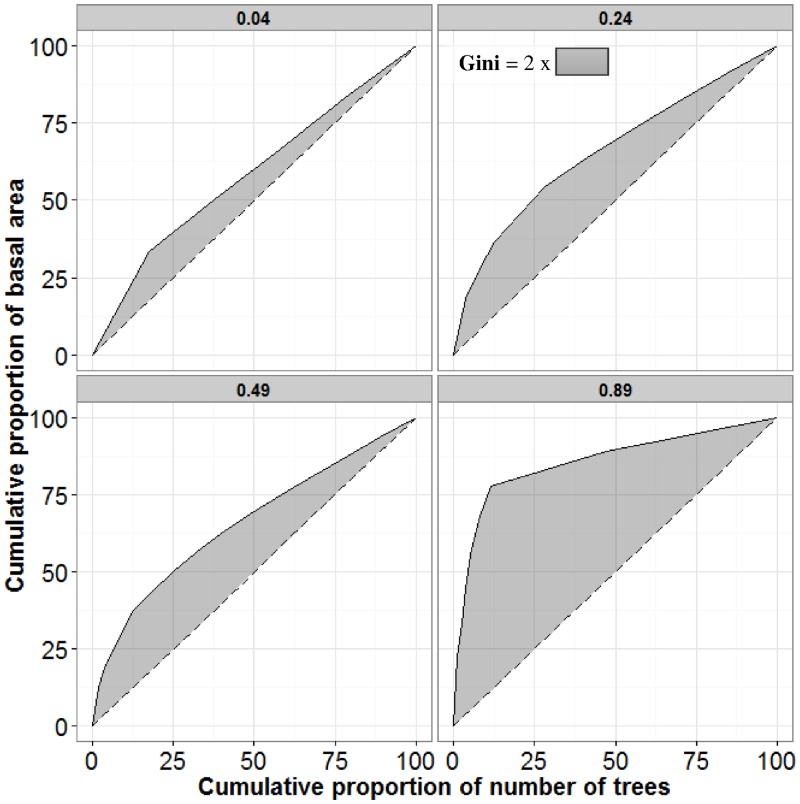
Fig 1. Lorenz curve to calculate the Gini coefficient index for 4 different inventory plots.
The Gini coefficient values are presented in the title of each facet. Trees are ranked according to their size (in our case individual tree basal area) in a descending order (according to Valbuena et al. 2013 [49]). The dashed lines represent the line of absolute equality.

