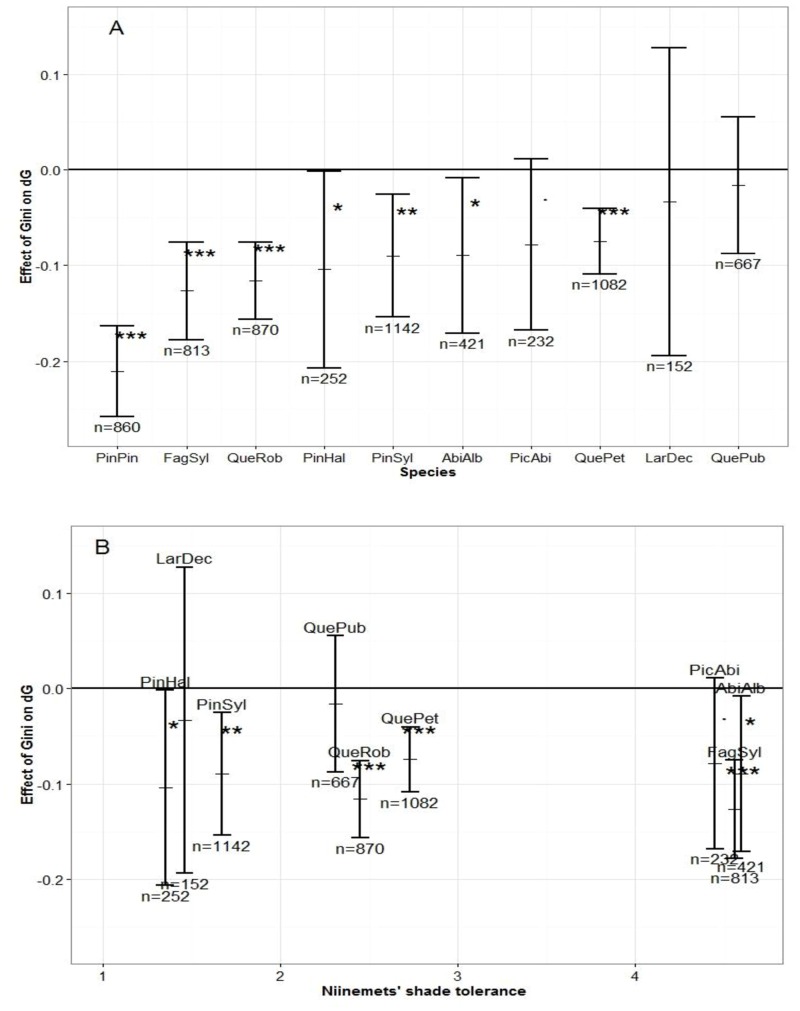
Fig 2. Effect of Gini coefficient (δ from Eq 3) on productivity (dG).
The results are presented according to species sensitivity to size heterogeneity (A) or to their shade tolerance (B). Pinus Pinaster was removed from (B) because there is no shade tolerance value in Niinemets & Valladeres (2006). Levels of significance are indicated on the graph based on a log-likelihood ratio test: (.) p-value <0.1, (*)<0.05, (**)<0.01, (***)<0.001. p-values are available in S3 Appendix for all variables.

