
Fig 2. Serial changes in the cell surface area at different glucose concentrations.
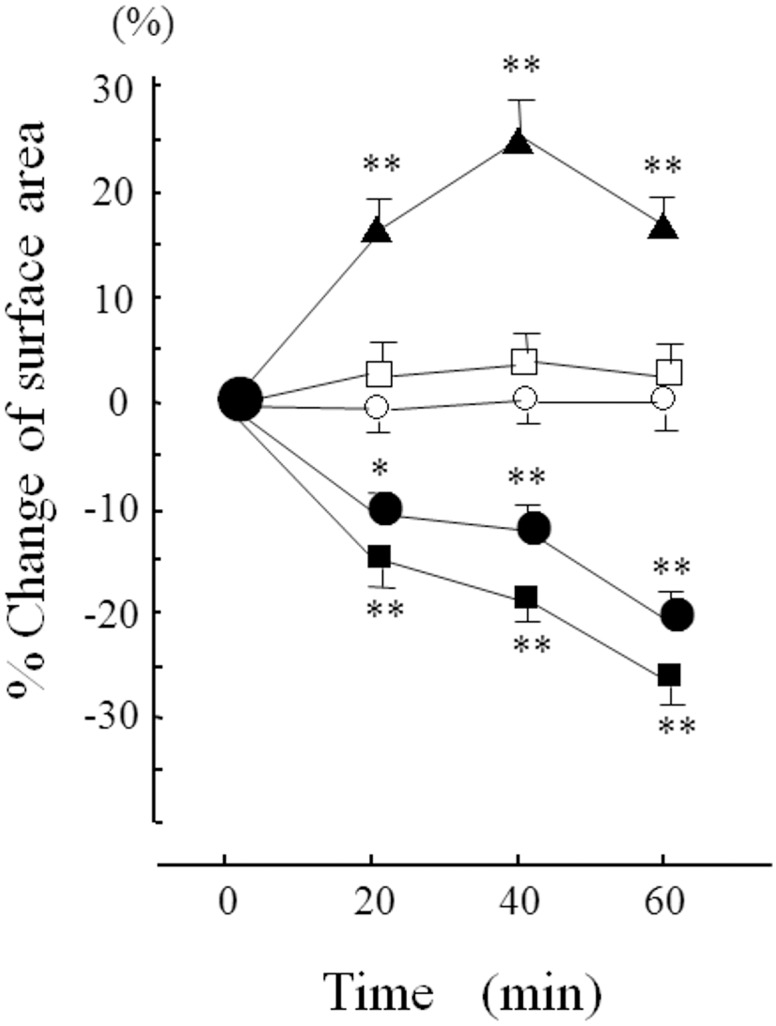
▲: 2.5 mM glucose, ○: 5 mM glucose, □: 5 mM glucose + mannitol, ●: 10 mM glucose, ■: 20 mM glucose. n = 6 in each condition. Data are the mean ± SD. Changes in surface area were measured every 20 min. *: p<0.05 vs 5 mM glucose for the same period, **: p<0.01 vs 5 mM glucose for the same period.