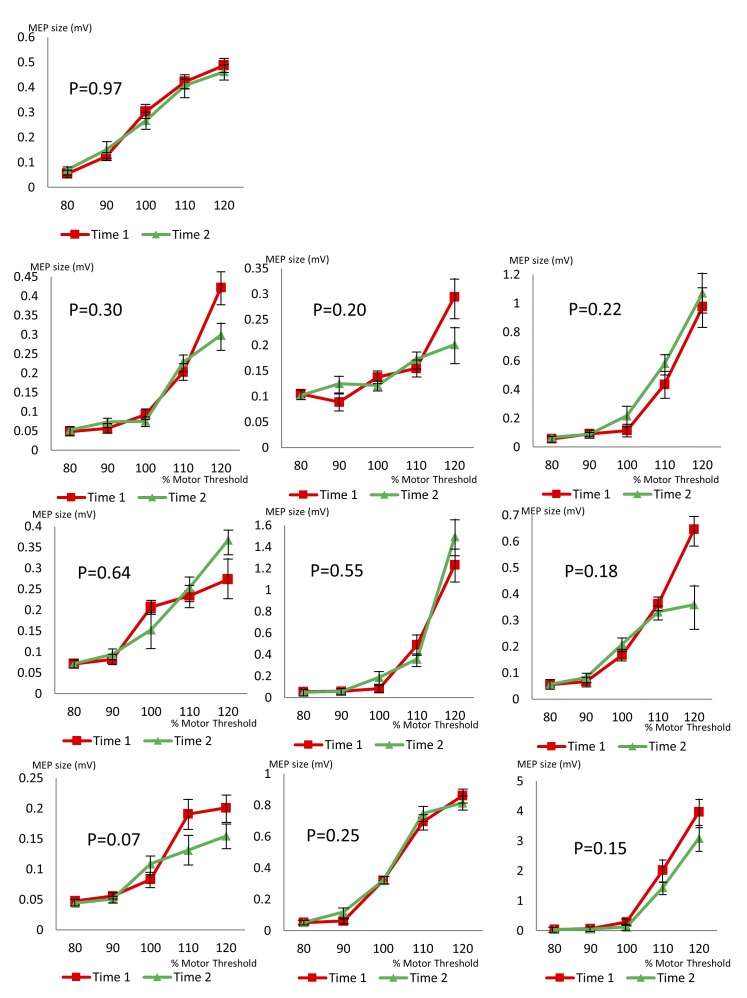
Fig 6. Stimulus-response curves for ten healthy control subjects.
Each graph shows two stimulus-response curves from the same subject, during the same testing session, demonstrating no significant change in cortical excitability. P values were calculated using multivariate ANOVA comparing MEP size at Time 1 and Time 2, across stimulation intensities. Error bars show standard error.

