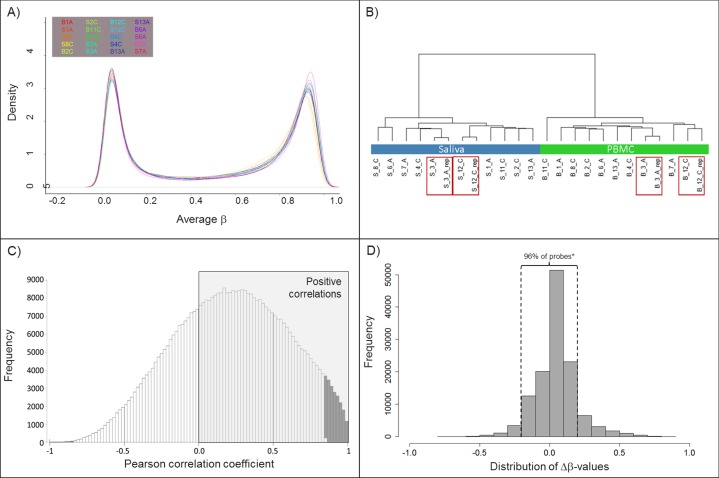
Fig 1. Data clustering and comparison between PBMC and saliva DNA methylation profiles.
A) Density plots for methylation levels (expressed as average β-values) from PBMC and saliva samples from all 10 individuals; B) Hierarchical clustering based on correlation distances of whole genome methylation profiles in 24 samples; including PBMC and saliva samples from 10 individuals + technical replicates of PBMC and saliva for 2 individuals (red boxes); C) Pearson correlation coefficients for methylation levels of PBMC versus saliva for each of the CpG sites (positive correlations in grey area, statistically significant correlations (Padj<0.05) are shown as grey bars); D) The number of cg-probes that showed significant differential methylation in saliva versus PBMC (Padj.<0.001), plotted against the difference in methylation expressed as Δβ-values. * The majority of the CpG sites (96%) show less than 20% difference in methylation between blood and saliva. Samples are coded with either B for PBMC or S for saliva, followed by the ID number and C for control or A for RA cases group; _rep indicates technical replicates.

