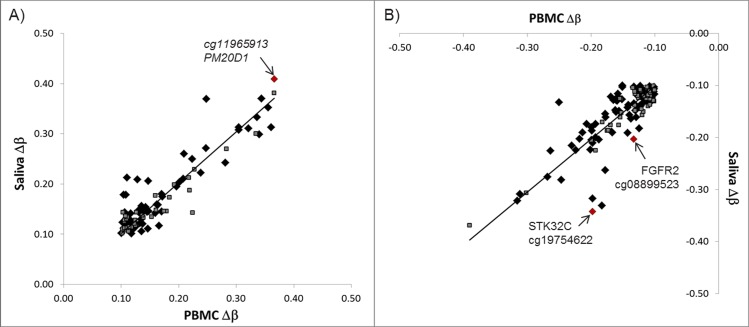
Fig 3.
Correlation for hypermethylated (A; ρ = 0.78, P<0.001) and hypomethylated (B; ρ = 0.74, P<0.001) probes in common between PBMC and saliva. Black diamonds represent DMS located in annotated genes; grey squares are non-annotated DMS; red diamonds correspond to the CpG sites in 3 different genes that were selected for verification via bisulfite pyrosequencing.

