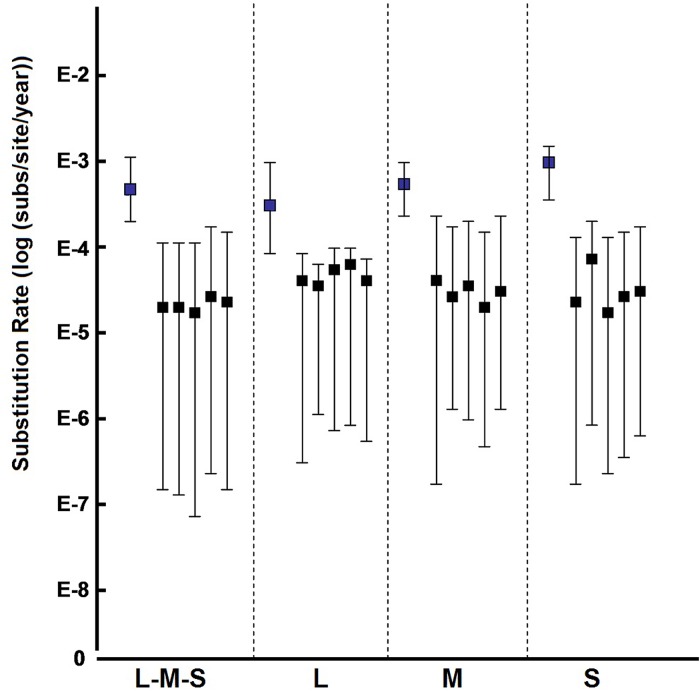
Fig 2. Posterior mean and 95% HPDs of the substitution rates estimated from the actual data sets and the 5 tip-date randomizations for the each data set.
Substitution rates on the left for each data set were estimated from the actual data sets. Substitution rates on the right for each data set were estimated from the randomized data sets. The mean rates estimated for the data sets were significantly different from those estimated from the randomized data sets.

