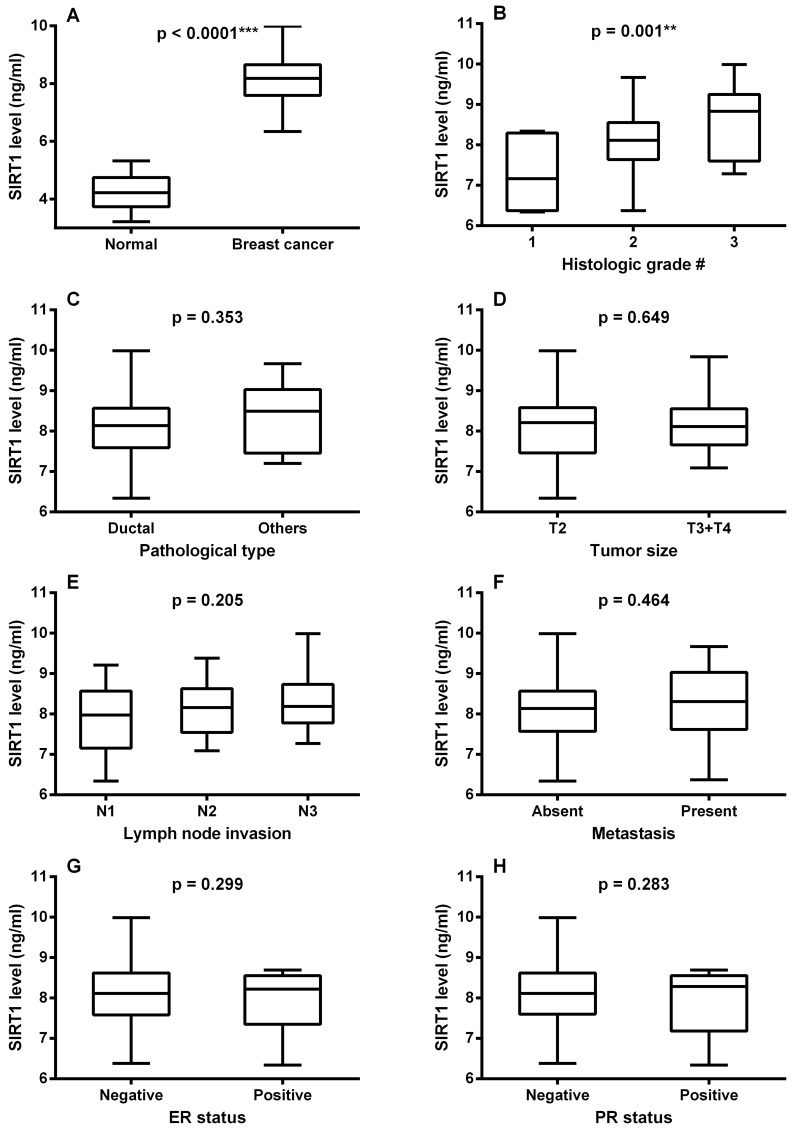
Fig 1.
Box plot of serum SIRT1 levels (A) in normal subjects and breast cancer patients, (B) with tumor types, (C) with tumor histological grades, (D) with tumor size, (E) with lymph node invasion, (F) in presence and absence of metastasis, (G) with ER status and (H) with PR status. The lines inside the boxes denote the medians. The boxes mark the interval between the 25th and the 75th percentiles. The whiskers denote the interval between the minimum and maximum values. Data are expressed as mean ± S.E. * and *** represent statistical significance at p < 0.05 and p < 0.001, respectively. † modified Bloom–Richardson grading system; T size of the tumor; N regional lymph node involvement; ER, estrogen receptor; PR, progesterone receptor

