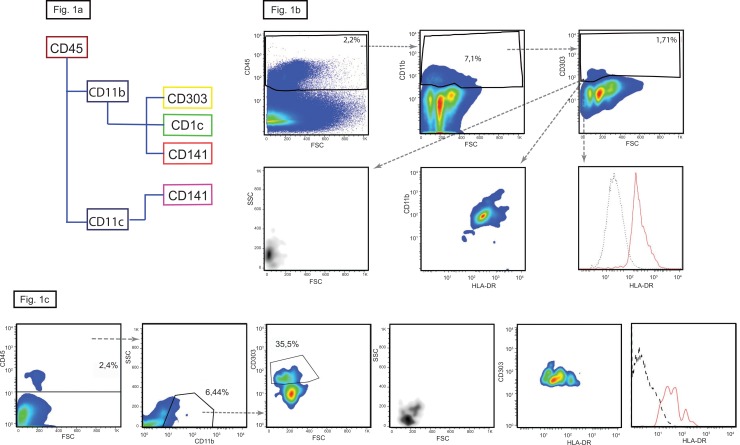
Fig 1. Plasmacytoid dendritic cells in hukman kidney.
(a) Gating strategy with the markers used to differentiate between the pDC in yellow, cDC1 in purple and cDC2 in green. (b) CD303+ pDCs are less then 2% of the total CD11b+ cells (upper panels). Plasmacytoid DCs are small and round cells positive for HLA-DR (lower panels). In here the plots of the kidney n° 4 are shown, similar results were obtained with the kidney n° 5. (c) In here the plots of the kidney n°2 characterized by high numbers of infiltrating pDC are shown, similar results were obtained with the kidneys n° 1 and 3.

