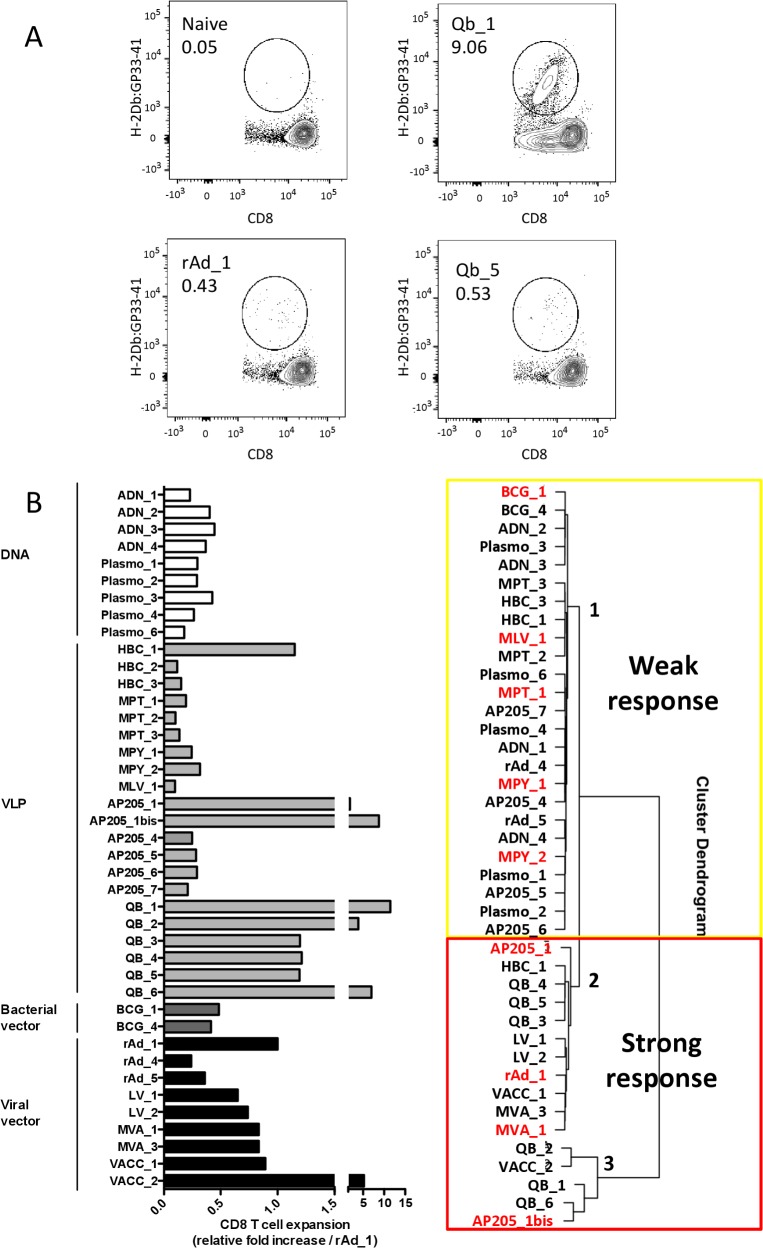
Fig 1. LCMV gp33-41 model antigen-expressing/displaying vector T-cell response analysis.
A. Evaluation of gp33-41 specific T-cell frequency in mice immunized with Qb_1 or Qb_5 VLPs, with rAd_1 and control naive mice, by H-2Db:gp33-41 tetramer staining. B. For each vector tested, gp33-41 antigen-specific responses were evaluated at days 5, 7 and 10 in groups of 3–5 vaccinated mice. The normalized “CD8 T-cell expansion” value was calculated as the average of the peak response for each mouse against the value obtained for the internal standard experimental group (rAd_1). C. Hierarchical clustering (Euclidean/Ward.D2) performed on normalized T-cell response values defined as “Weak” (cluster 1) and “Strong” (clusters 2 and 3) vectors. Vectors in red were used to build the initial prediction model (see Model stability and confidence in the Results section).

