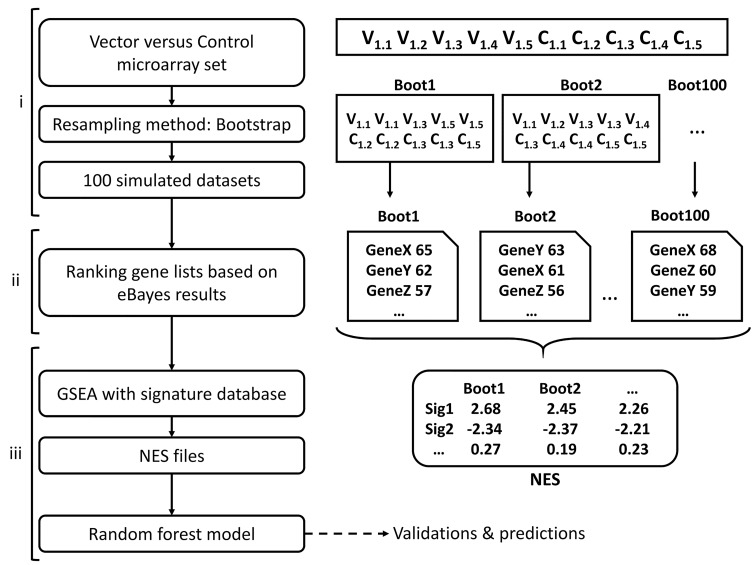
Fig 2. Modelling strategy.
(i) For each pre-processed dataset, composed of microarray measures for mice injected with vector 1 (V1.1, V1.2 …) and control (C1.1, C1.2 …), one hundred datasets were created by bootstrapping samples among V and C. (ii) Ranked gene lists, according to the eBayes statistical comparison of vector and control conditions, were generated. (iii) Potential signatures were tested for enrichment on each of the 100 ranked gene lists by GSEA. The resulting NES matrix was then used to build the random forest model.

