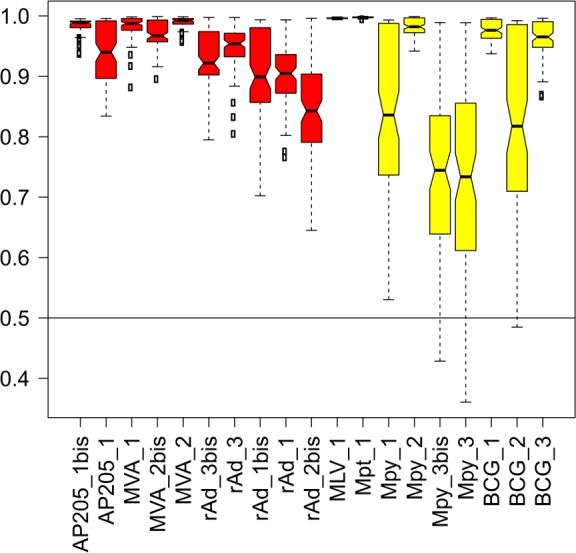
Fig 4. Vector prediction confidence.

One hundred different models were created using one representative of each vector platform. The probabilities for a vector being classified as expected were calculated for its 100 bootstrapped datasets and averaged as a vector mean probability. Vector mean probabilities are displayed as boxplots. A value of 1 means that the bootstrapped dataset was successfully predicted 100 times over the 100 models. “Strong” and “Weak” vectors are colored red and yellow, respectively.
