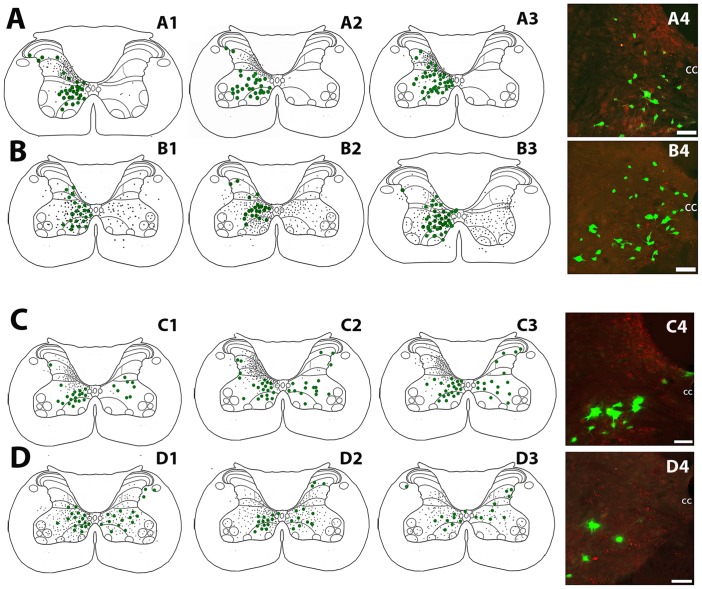
Fig 3. Distribution of local commissural interneurons and long descending propriospinal interneurons in relation to corticospinal and reticulospinal terminations in the cervical spinal cord for each rat used in the study.
Cells are represented as green dots and axon terminals as small black dots on spinal outline diagrams of the C4/5 cervical segments. A1-4: Distribution of local commissural interneurons (LCINs) and corticospinal terminals (CST). A4 is a projected confocal image showing the distribution of LCINs (green) CST terminals (red) adjacent to the central canal. B1-4: Distribution of LCINs and reticulospinal (RST) terminals. B4 is a projected confocal image showing LCINs and RST terminals. C1-4: Distribution of long descending propriospinal neurons (LDPNs) and CST terminals. C4 is a projected confocal image showing LDPNs and CST terminals. D1-4: Distribution of LDPNs and RST terminals. D4 is a projected confocal image showing LDPNs and RST terminals. CC = central canal in confocal images. Scale bars = 50μm.

