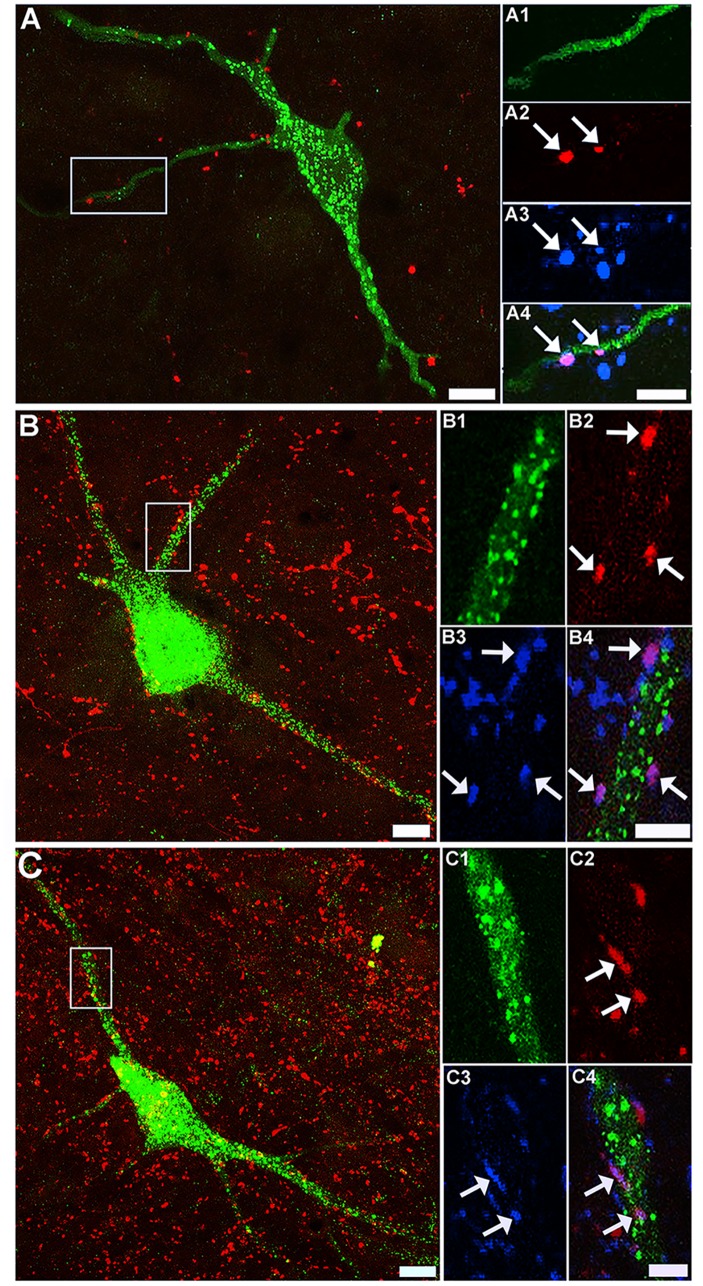
Fig 5. Confocal images of corticospinal and reticulospinal contacts on long descending propriospinal neurons.
A: a projected confocal microscope image of a FG-labelled LDPN (green) and CTb-labelled CST terminals (red) taken from the medial region of lamina VII (contralateral to the L1/L2 injection site; segment C5). Scale bar = 20μm. Insets A1—A4 are single optical sections that correspond to the region demarcated in A showing two CST contact on this cell (arrows). A1 immunoreactivity for FG; A2 immunoreactivity for CTb; A3 immunoreactivity for VGLUT1. A4 is a merged image of A1-3. Scale bar = 5 μm. B: a projected confocal microscope image of a FG-labelled cell (green) and CTb-labelled RST terminals (red) taken from the medial region of lamina VII (contralateral to lumbar injection; segment C5). Scale bar = 20μm. Insets B1—B4 are single optical sections that correspond to the region demarcated in B. B1 immunoreactivity for FG; B2 immunoreactivity for CTb; B3 immunoreactivity for VGLUT2. B4 is a merged image of B1-3: the arrows indicate VGLUT2-positive contacts. Scale bar = 5 μm. C: a projected confocal microscope image of a LDPN (green) and CTb-labelled RST terminals (red) in segment C5. Scale bar = 20μm. C1—C4 are single optical sections that correspond to the region demarcated in C. C1 immunoreactivity for FG; C2 immunoreactivity for CTb; C3 immunoreactivity for VGAT. C4 is a merged image of C1-3: the arrows indicate VGAT-positive contacts. Scale bar = 5 μm.

