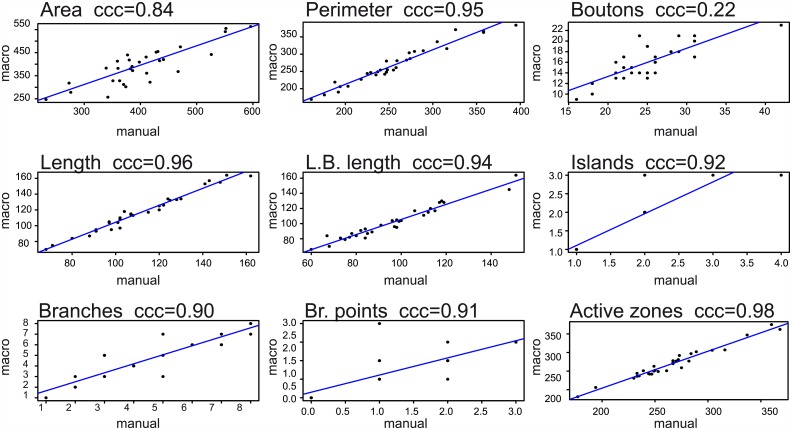
Fig 2. Macro validation.
The graphs represent the concordance correlation coefficient (ccc) between manually assessed NMJs on the x-axis and the macro results on the y-axis for each feature separately. Each data point represents the intersection of macro and manual measurement for a given NMJ sample (n = 30). Because of identical (whole number) counts, data points are often superimposed for islands, branches and branching points.

