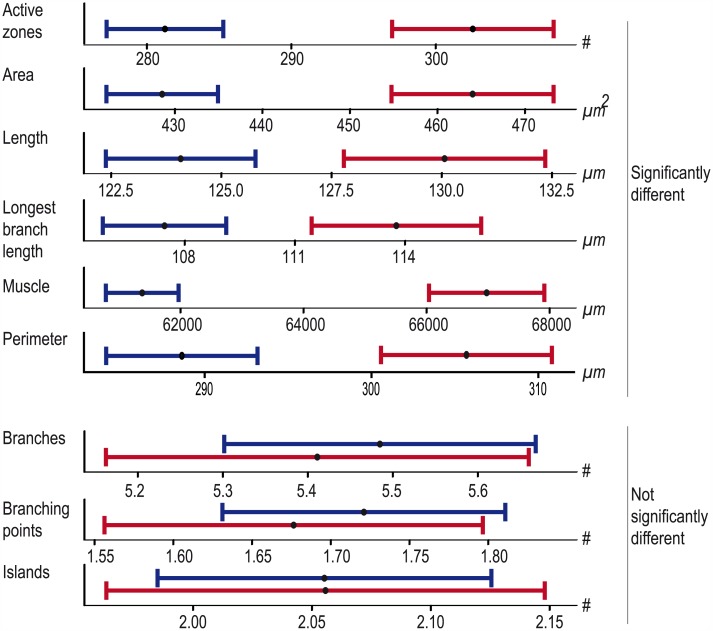
Fig 4. The influence of gender on NMJ features.
The plots display the mean value (black dot) and 95% confidence interval for each indicated feature. Males are represented in blue, females in red. The features are significantly different between sexes for the size-related NMJ features (upper panel), whereas they largely overlap for structural NMJ features (lower panel).

