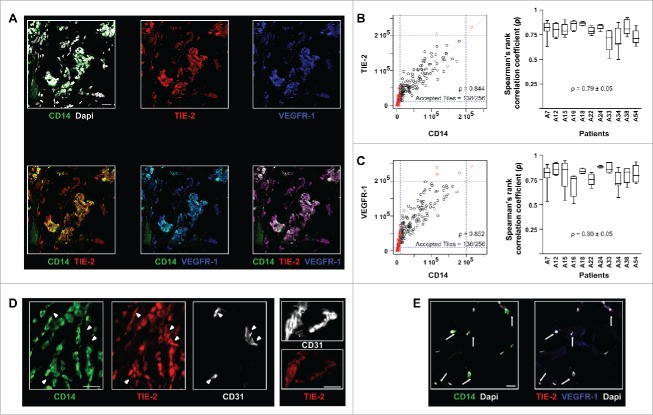
Figure 1.
In human breast tumors, TEM can be identified solely based on CD14 immunostaining. (A) Immunofluorescence staining and confocal analysis of human BC tumor sections showing CD14, TIE-2 and VEGFR-1 triple positive cells. Representative image from 16 patients; (B) CD14 and TIE-2 expression correlation analysis. The dot plot (left panel) represents all tiles for one representative image; the box plot (right panel) shows the Spearman’s rank correlation coefficient (ρ) for CD14 and TIE-2 expression in 11 patients. In the dot plot, 54% of CD14+ tiles and 70% of TIE-2+ tiles were above the threshold. 100% of CD14+ tiles were TIE-2+ which means that the high correlation (ρ = 0.844) applied to all CD14+ tiles; (C) CD14 and VEGFR-1 expression correlation analysis for 11 patients. In the dots plot, 55% of CD14+ tiles and 75% of VEGFR-1+ tiles were above the threshold. 100% of CD14+ tiles are VEGFR-1+ which means that the high correlation (ρ = 0.852) applied to all CD14+ tiles; (D) Example of TIE-2 expression in TEM, clusters of BEC (arrow heads) and blood vessels (right panel) shown in confocal microscopy images of BC sections. TEM and blood endothelial structures were stained with CD14 and CD31, respectively; (E) Example of immunofluorescence labeling of CD14, VEGFR-1 and TIE-2 in sections containing non-neoplastic breast tissue adjacent to tumor tissues. CD14+ cells (arrows) are VEGFR- and TIE-2-. Non-neoplastic (panel E) and tumor tissue (panel A) were stained and imaged simultaneously under the same conditions and thus intensities of the expression of TIE-2 and VEGFR-1 signals can be compared. Representative images from four patients. Scale bars: 25 μm.

