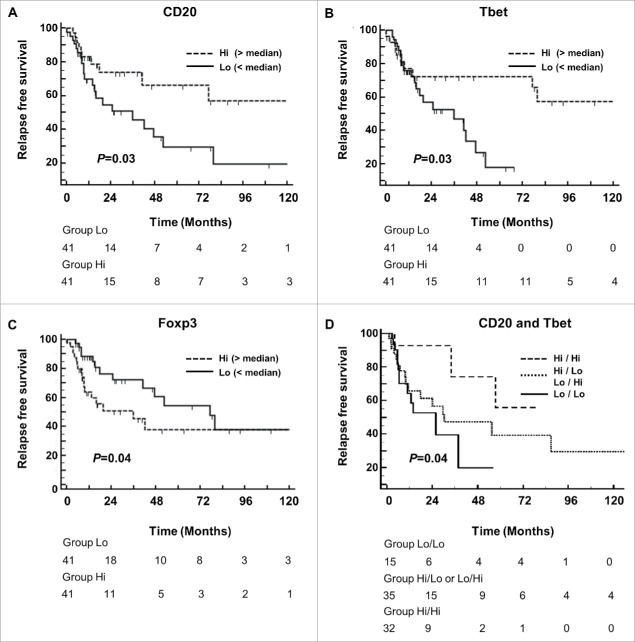
Figure 2.
Correlation between immune infiltrates and gastric cancer patient survival. Kaplan–Meier curves for recurrence-free survival (RFS) stratified according to (A) the number of CD20+ B cell aggregates (< or > to the median value), (B) the number of intratumoral Tbet+ cells, (C) the number of intratumoral Foxp3+ cells, and (D) according to both CD20+ B cell aggregates and T-bet+ cells. P-values were calculated using the log-rank test.

