
Figure 4.
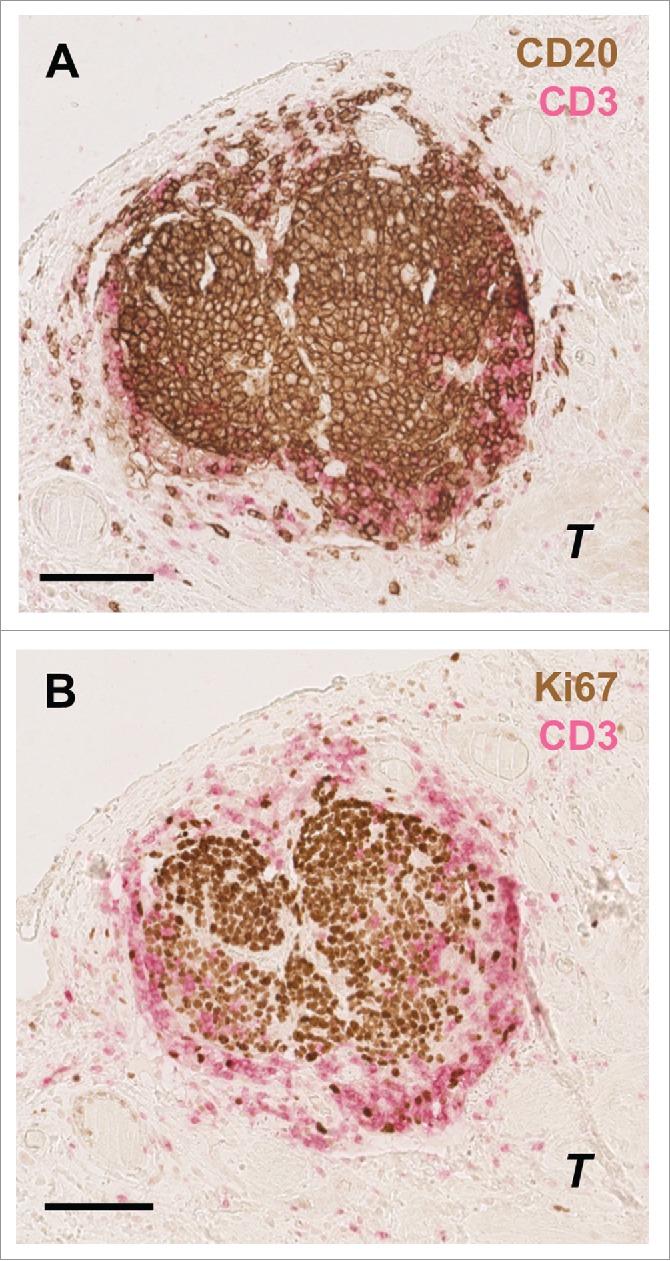
Characterization of T and B cells interaction in germinal centers in the gastric cancer microenvironment. Consecutive slides showing the same B cell zone (A) surrounded by T cells (CD20: brown; CD3: pink). (B) Some of these tumor-associated CD20+ B-cell follicles contained Ki67+ (Ki67: brown) proliferating germinal center B cells. Scale bar indicates 100 µm. T indicates tumor cells.