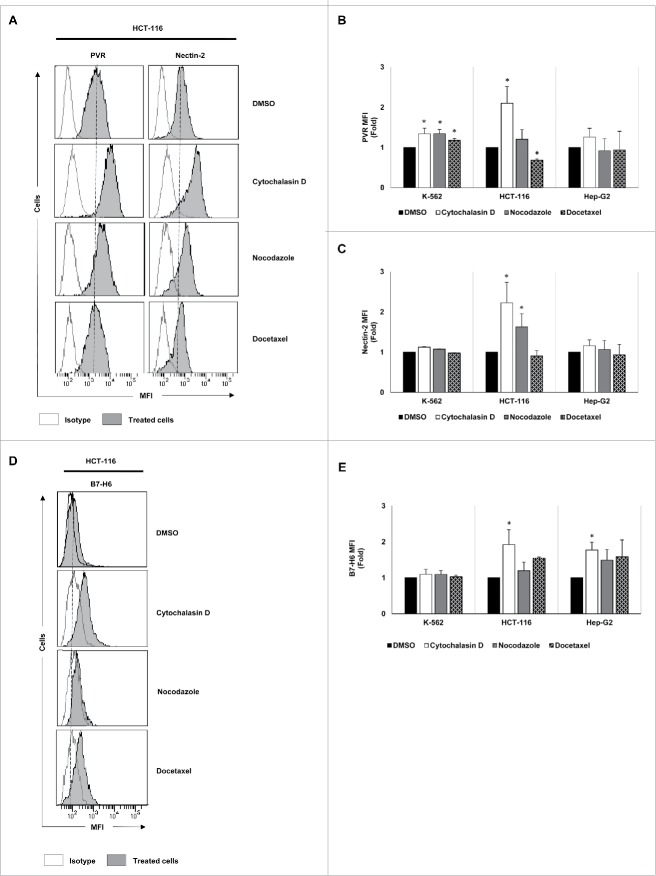
Figure 3.
Analysis of the tumor expression of DNAM-1 and NKp30 ligands upon treatment with drugs that induce cell hyperploidy. K-562, HCT-116 and Hep-G2 cells were treated with cytochalasin D, nocodazole or docetaxel for 48 h, and the membrane expression of PVR (A and B), Nectin-2 (A and C) and B7-H6 (D and E) was analyzed by flow cytometry. (A and D) A representative experiment performed in HCT-116 cells is included. Isotypes for each condition are shown as empty histograms and treated cells are shown as gray histograms. (B, C and E) The bars represent the mean of the fold induction ± SEM of the MFI of the treated cells relative to the vehicle-treated control (at least three independent experiments were performed; *p < 0.05; **p < 0.01).

