
Figure 1.
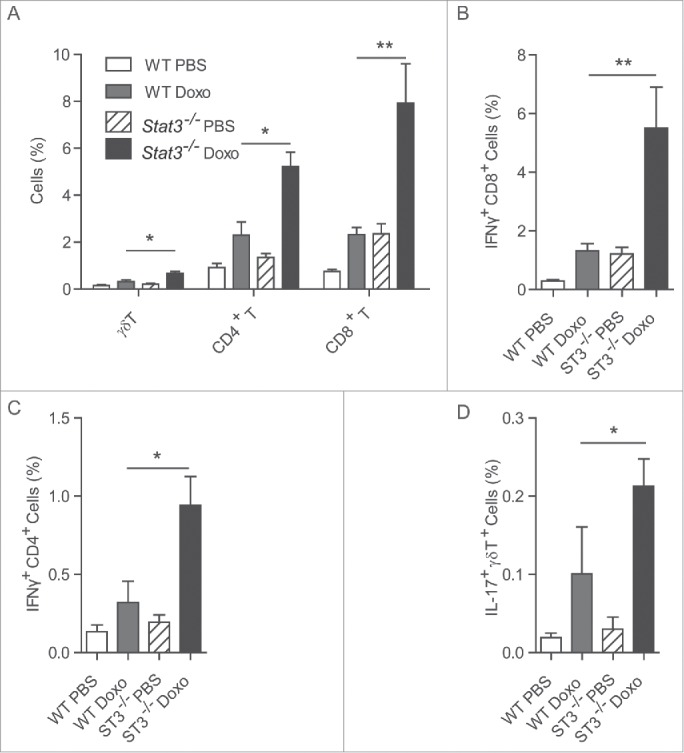
Cytofluorometric analysis of tumor-infiltrating T lymphocytes. MCA205 fibrosarcoma cells that were either wild type (WT) or Stat3−/− were inoculated into histocompatible C57Bl/6 mice. Once palpable the tumors were either injected with doxorubicin or PBS as a vehicle control. Seven days after intratumoral injection of chemotherapy, the fibrosarcomas were retrieved and digested with 0.4 Wünsch units/mL Liberase TL (Roche) and 200 U/mL DNase I (Calbiochem), cultured for 4 h in the presence of phorbol 12-myristate 13-acetate (20 ng/mL) + ionomycin (1 µg/mL) + brefeldin A (3µg/mL) and then stained to determine the expression of CD3, CD4+, CD8+, γ/δ T cell receptor on the cell surface, as well as that of interferon-γ (IFNγ) and interleukin-17 (IL-17) within the cytoplasm. (A). Proportion of γ/δ T cells, CD4+ α/β T cells and CD8+ α/β T cells among viable (Vivid yellow−) cells. (B). Proportion of IFNγ-producing CD8+ α/β T cells. (C). Proportion of IFNγ-producing CD4+ α/β T cells. (D). Proportion of IL-17-producing T cells among γ/δ T cells. Values are means ± standard error of the mean (n = 5 per group). Asterisks mark significant differences (*, p < 0.05, **, p < 0.01,) between groups, as determined by the Student t test.