
Figure 3.
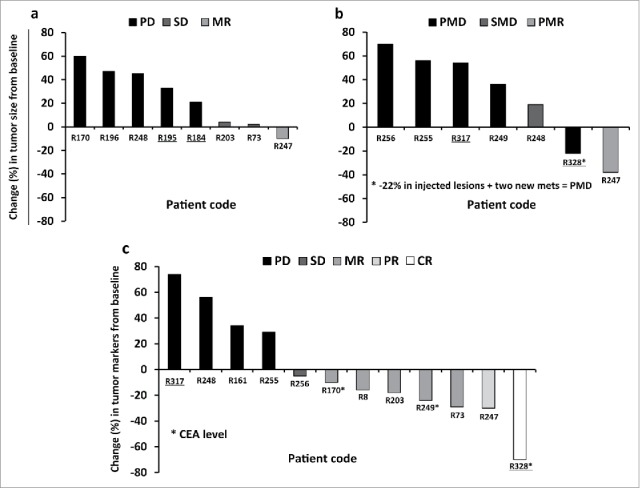
Waterfall plots showing radiological and tumor marker responses after Ad5/3-D24-GMCSF treatments in breast cancer patients. (A,B) Percent change in tumor burden relative to pre-treatment baseline is represented. (A) CT, and (B) PET-CT are shown. (C) Percent change in Ca15–3 or CEA levels (patients R170, R249 and R328) relative to pre-treatment baseline is represented. Patient R196 (PD) is not represented in the graph (percent change was not measured). For patient R170, “best response” is shown. TNBC patients are underlined. Mets, metastases. (A,B) n = 13. Patients R247 and R248 have been imaged with both CT and PET-CT; (C) n = 12.