
Figure 1.
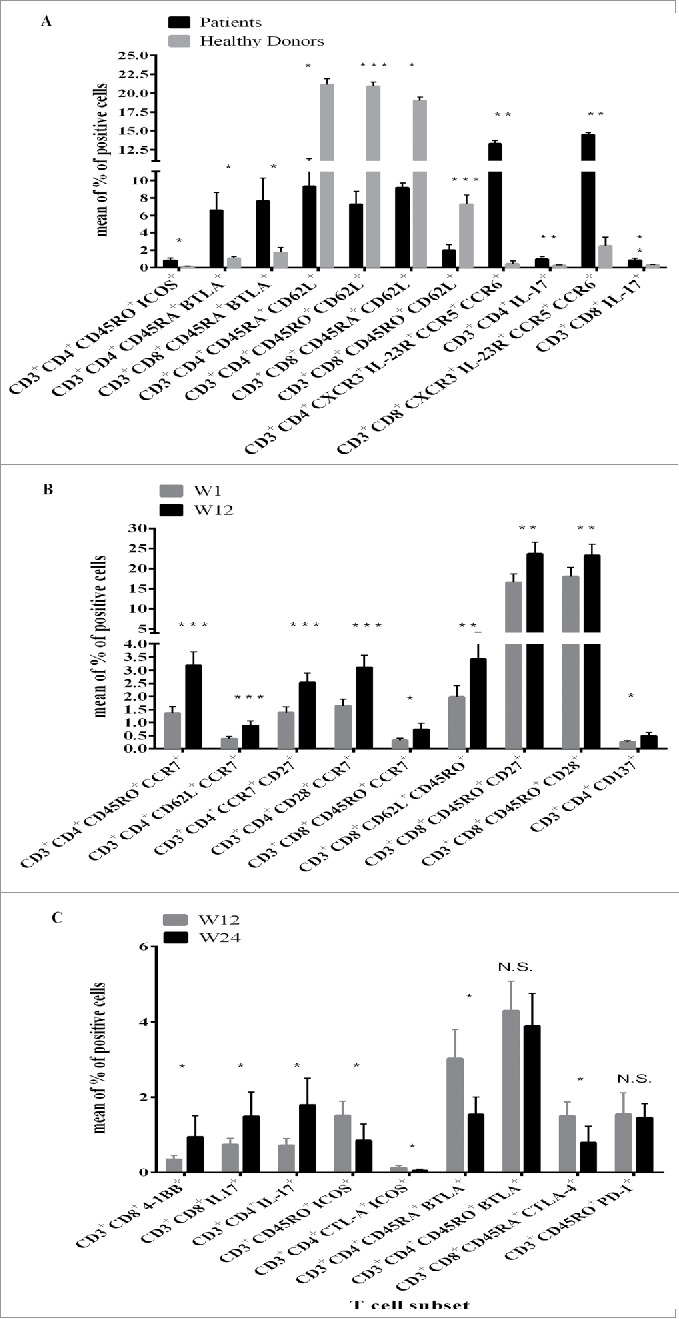
Frequency of T cell subsets in PBMCs of MM patients at baseline as compared with HD or in relation with IPI plus FTM treatment. The phenotype characterization of T cell subsets was performed by IF and cytofluorimetric analysis (see Table S1 and Material and Methods) on PBMCs from MM patients or HDs. The lymphocytes were gated by physical parameters (FSC × SSC) and then gated either on CD3+, CD3+CD4+, CD3+CD8+, CD3+CD4+CD45RA+, CD3+CD4+CD45RO+, CD3+CD8+CD45RA+ or CD3+CD8+CD45RO+ cells (Fig. S1). The surface markers were evaluated in association with these gated lymphocyte subsets. For Th17 T cell subset the expression of CXCR3, CD161, CCR5, CCR6, IL-23R 2 or of the intracellular staining for IL-17 were evaluated in association with either the CD3+CD4+ or CD3+CD8+ gated cells. Results were measured as % of positive cells subtracted of the negative control values. Panel A. PBMCs from N = 31 MM patients (black bar) enrolled in the NIBIT-M1 clinical study and from N = 10 HDs (gray bar) were analyzed. In the figure the mean of the % of positive cells and the standard error (SE) are represented. Panel B: The changes in the frequency of T cell subsets in MM patients were analyzed at baseline (W1; gray bar) and along with therapeutic treatment (W12; black bar). Results are shown as the mean of the % of positive cells and the related standard error (SE). Panel C: Changes in terms of the mean of the % of positive cells for defined T cell subsets at W12 (gray bar) versus W24 (black bar) post-treatment in MM patients are shown. The standard error for each bar is represented a swell. For all the result differences in means were assessed with the Student t-test. *: p < 0.03; **: p < 0.004; ***: p < 0 .0001; N.S.: not significant.