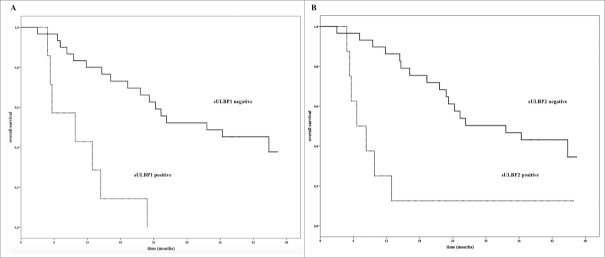
Figure 2.
Kaplan–Meier plots of OS of MM patients in relation with the levels at baseline of soluble ULBP-1 and ULBP-2 The detection (gray line) or not (black line) sULBP-1 (Panel A) or sULBP-2 (Panel B) in the serum of baseline from MM patients (N = 37) could discriminate patients with long term survival (median OS = 33.6 mo) from poor survivors (median OS = 9.8 or 6.6 mo, respectively); ULBP-1: p < 0.0001; ULBP-2: p < 0.001, mo.: months.

