
Figure 2.
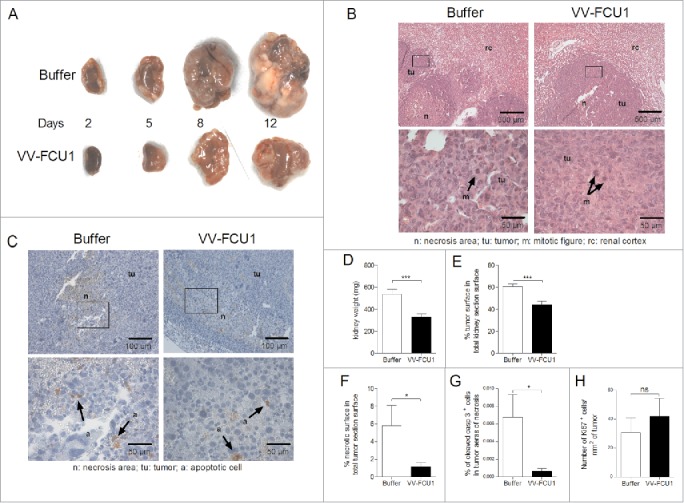
Tumor growth limitation effects of VV-FCU1. RenCa cells were injected into the subcapsular space of the left kidney of female BALB/c mice. Twelve days after cells implantation, mice were treated i.p. with VV-FCU1 or buffer (day 0). Those injections were repeated at day 3 and 6 after the first one. The orthotopic tumors were resected 2, 5, 8, and 12 d after the first VV-FCU1 injection. (A) Representative macroscopic view of the sampled orthotopic tumors is shown in the indicated treatment groups. (B) Representative hematoxylin eosin stained tissue sections of tumors excised at day 8 after the beginning of VV-FCU1 injections, showing renal cortex, tumor and tumor necrotic areas in buffer- and VV-FCU1-treated animals. Upper panels: 40× magnification, lower panels: 400× magnification. Areas magnified in the lower panels are framed in the upper panels. (C) Representative immunodetection of cleaved caspase 3. Sections of tumors excised at day 8 following onset of oncolytic virotherapy, were processed for the detection of cleaved caspase 3 by IHC. Upper panels: 100× magnification, lower panels: 400× magnification. Areas magnified in the lower panels are framed in the upper panels. (D) Weight of tumor bearing kidneys sampled at day 8 after the first injection of VV-FCU1. (E) Percentage of tumor surface in total kidney section surface at day 8 following onset of oncolytic virotherapy. Stained sections as in (B) were scanned with a nanozoomer. Tumor areas were delineated manually using the Calopix software to calculate the percentage of tumor tissue within total kidney section. (F) Percentage of necrotic surface in total kidney tumor section surface at day 8 after the beginning of VV-FCU1 treatment. Stained sections as in (B) were scanned with a nanozoomer. Necrotic areas were delineated manually using the Calopix software to calculate the percentage of necrotic tissue within total kidney tumor section. (G) Percentage of apoptotic cells in total kidney tumor section surface at day 8 after initiation of VV-FCU1 therapy. Sections obtained in (C) were scanned with a nanozoomer and the percentage of cleaved caspase 3 positive cells within necrotic areas was determined using the Calopix software. (H) Percentage of proliferating cells in total kidney tumor section surface at day 8 following onset of oncolytic virotherapy. Sections were processed for the staining of Ki67+ cells by IF and were scanned with a nanozoomer. The percentage of Ki67+ cells was determined using the Calopix software. Results are from two independent experiments, each including 10 animals. (ns not significant, *p <0.05, ***p < 0.001).