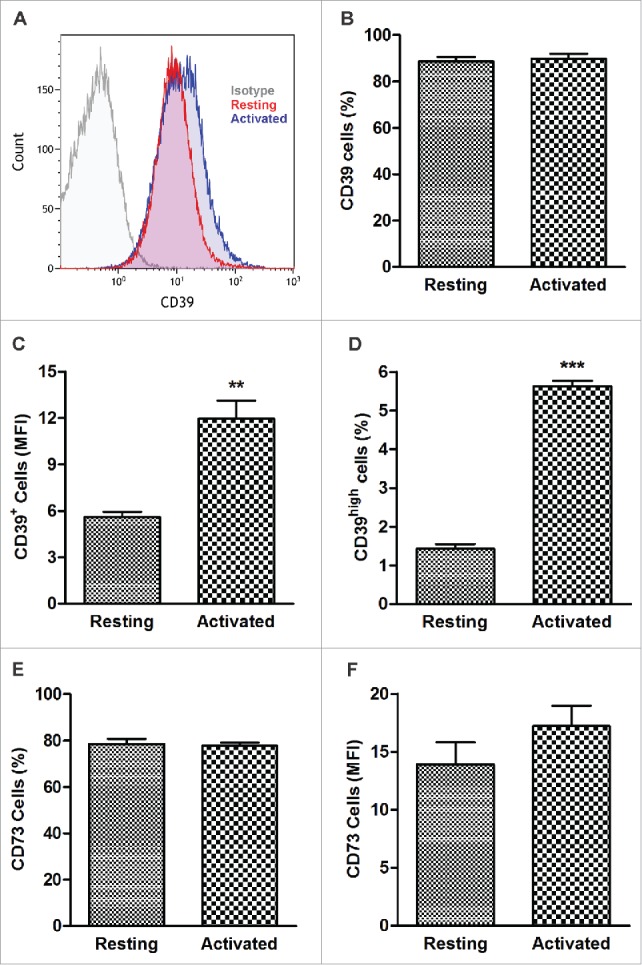
Figure 1.

CD39 and CD73 expression in resting and activated human B cells. CD20+ B cells were tested by flow cytometry immediately after isolation from the peripheral blood or after 4 d of activation in the presence of IL-4 and CD40L. (A) Representative histograms illustrating upregulation of CD39 expression levels in activated B cells. Isotype control (left), resting B cells (center) and activated B cells (right). (B) Percentages of CD39+ B cells in resting and activated populations were comparable (NSD). CD39+ B cells accounted for > 90% of all cells. (C) Expression levels (Mean Fluorescence Intensity, MFI) of CD39 in resting and activated B-cells **p < 0.001. (D) Percentages of CD39high B cells in resting and activated populations. ***p < 0.0001. (E) Percentages of CD73+ B cells in resting and activated populations (NSD). (F) MFI of CD73 in resting and activated B cells. The data are mean values ± S.E.M. of five independent experiments, as determined by Student’s t-test.)
