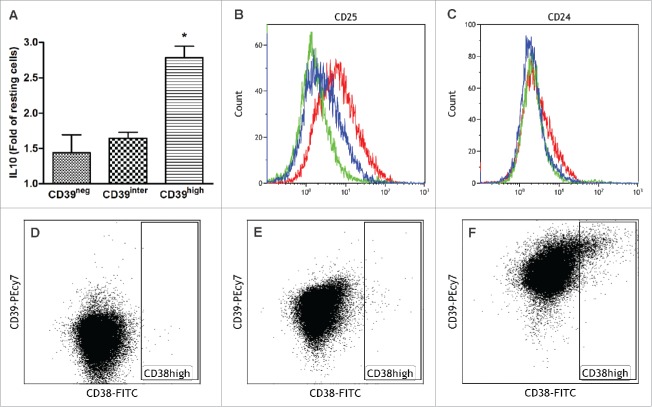
Figure 2.
Co-Expression of IL-10, CD39, CD24, CD25 and CD38 in the three sorted subsets of CD39+ B cells. Activated B cells were sorted for CD39 expression levels and analyzed by flow cytometry for co-expression of IL-10 (A), CD25 (B), CD24 (C) and CD38 (D–F). In (B) and (C), CD39neg cells are green, CD39inter cells are blue and CD39high cells are red. In (D–E), dot plots show CD38 expression levels in CD39neg B cells (D), CD39inter B cells (E) and CD39high B cells (F). The data are representative of three independent experiments (B–F). In (A), the data are mean values ± SEM of three independent experiments as determined by one-way ANOVA followed by post-hoc comparisons (Tukey). The same statistical analysis was used for the data shown in Figs. 3–5.

