
Figure 3.
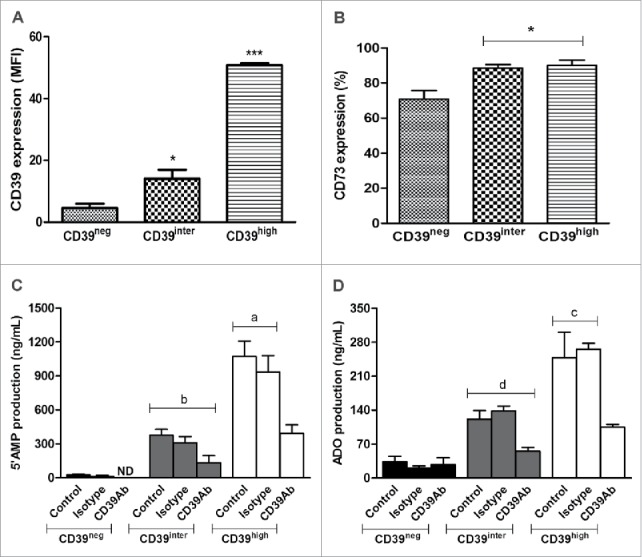
Expression of CD39 and CD73 on the surface of CD39neg, CD39inter and CD39high B cells and 5′AMP or adenosine production. Activated B cells were sorted relative to CD39 expression and analyzed by flow cytometry for surface expression of CD39 (A) or CD73 (B). In (A), CD39high B cells had higher (p < 0.001) mean expression levels of CD 39 than CD39inter B cells. In (B), significantly higher percentages (*p < 0.05) of CD39inter and CD39high B cells than CD39neg B cells co-expressed CD73. The results are presented as mean values ± S.E.M. of three independent experiments. In (C) and (D), the subsets of B cells (25,000 cells/well) were incubated with 20 µM ATP and the production 5′AMP and adenosine were analyzed by mass spectrometry. (C) 5′AMP production after B cell incubation in the presence of ATP with or without CD39-specific blocking Ab (or isotype control) is higher in CD39high B cells (ap < 0.001) than in CD39inter B cells (b). (D) Adenosine production after B-cell incubation in presence of ATP with or without CD39-specific blocking Ab (or isotype control) was also higher (cp < 0.05) in CD39high B cells than in CD39inter B cells (d). The results are presented as mean values ± S.E.M. of three independent experiments. CD39neg B cells produced minimal levels of 5′-AMP or ADO. ND stands for Not Detectable.