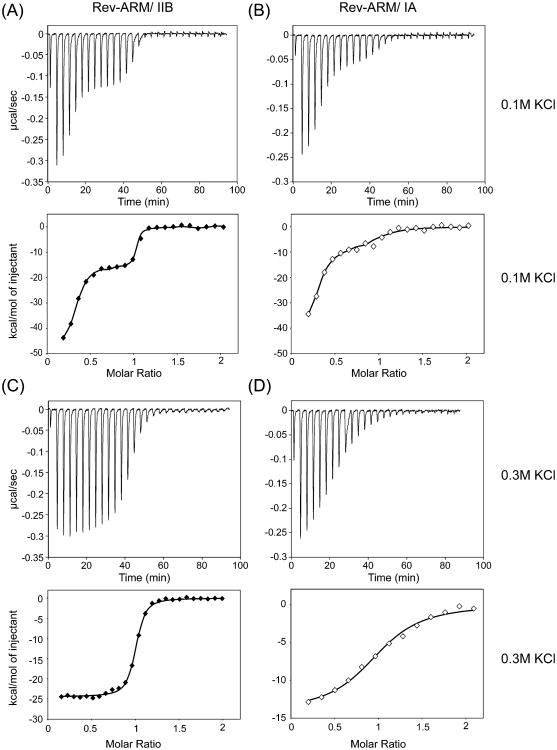
Figure 4.
Reverse titration by ITC indicates existence of specific and nonspecific binding. Titration of RNA (stem IIB or stem IA) into Rev–ARM at 0.1 M (A, B) and 0.3 M (C, D) KCl. Top panels show ITC traces, and bottom panels show integrated heat values. Isotherms are distinctly biphasic at 0.1 M KCl, reflecting both nonspecific and specific binding behavior, and are monophasic at 0.3 M KCl, reflecting exclusively specific binding. Traces appear similar at 10, 20, and 30 °C, for which data were collected and analyzed. Data were fit using the finite-lattice competitive binding model32,33 at 0.1 M KCl (A, B) and the single-site binding model at 0.3 M KCl (C, D).

