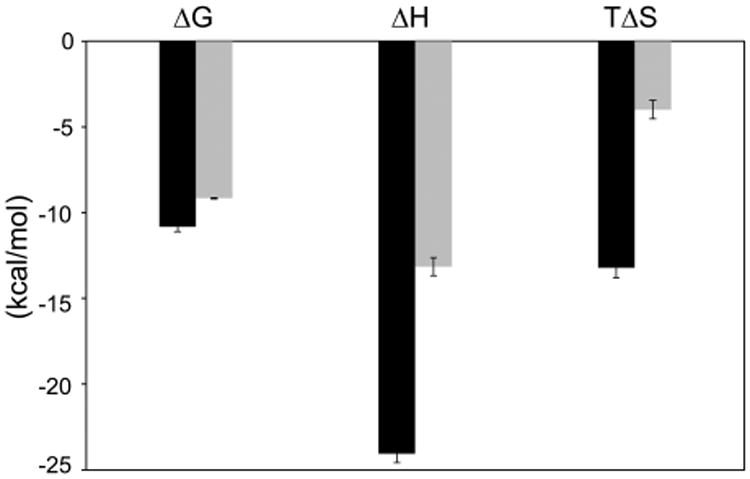
Figure 6.

Enthalpy–entropy partitioning reveals distinct thermodynamic signatures. Comparison of thermodynamic parameters for IIB (black bars) and IA (gray bars) binding at 0.3 M KCl and 20 °C indicates very different partitioning of free energy into enthalpy and entropy terms. The plot is qualitatively similar at other temperatures and at 0.1 M KCl and therefore generally represents the two interactions.
