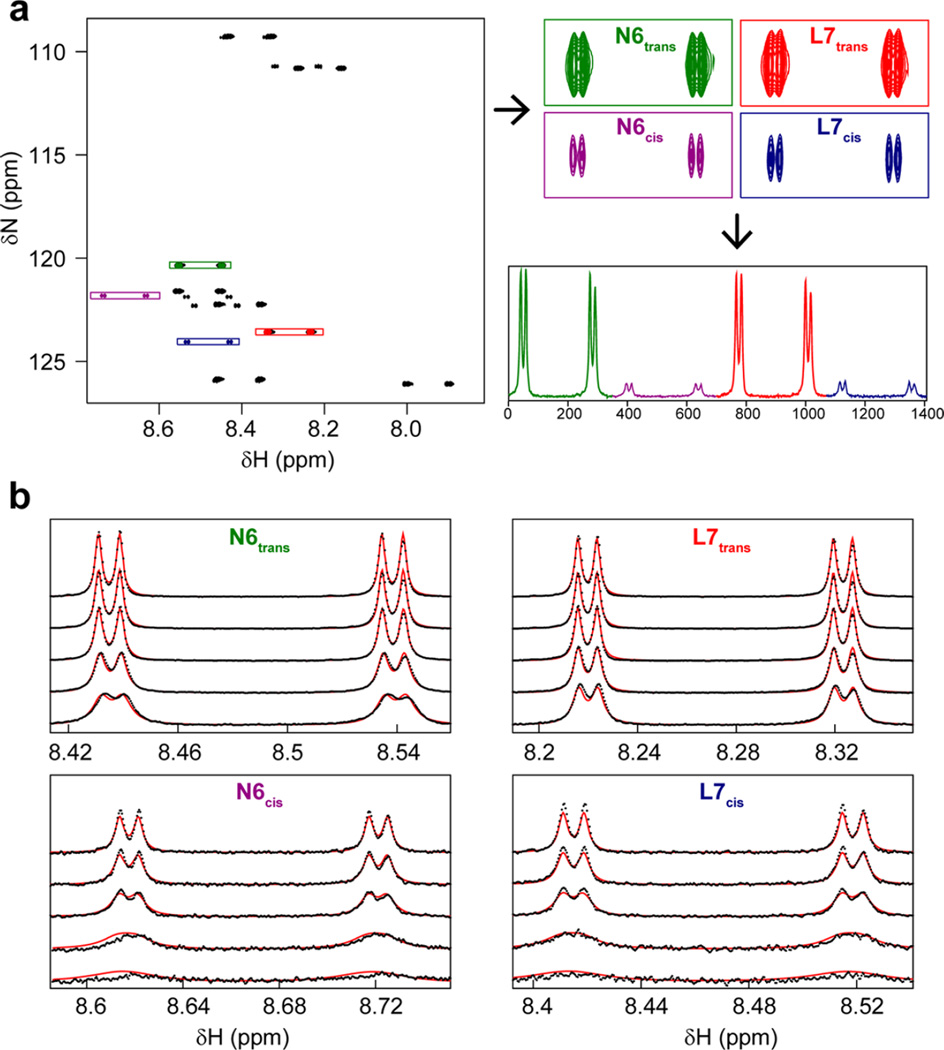
Figure 5.
Extraction and fitting line shape data. (a) High-resolution 15N HQSC spectra were collected on 15N-labeled peptide with variable concentrations of unlabeled cyclophilin without nitrogen decoupling during signal acquisition. Shown here is the peptide in the absence of enzyme. Peaks corresponding to residues Asp 6 and Leu 7 with Pro 5 in the cis and trans conformations were extracted using the windows indicated and summed over nitrogen to yield 1D proton spectra. (b) Line shape fitting for CypA. Fitting was performed as described in Materials and Methods, with data colored black and best-fit line shapes, determined simultaneously for all peptide and enzyme concentrations, colored red. For the sake of clarity, 1D spectra are shown only for 1 mM 15N-labeled peptide with 5, 10, 20, 50, and 100 µM CypA (top to bottom for each residue). Because of the low intensity relative to that of trans peaks, cis peak intensities have been scaled up by a factor of 5 in the bottom graphs for the purpose of visualization.

