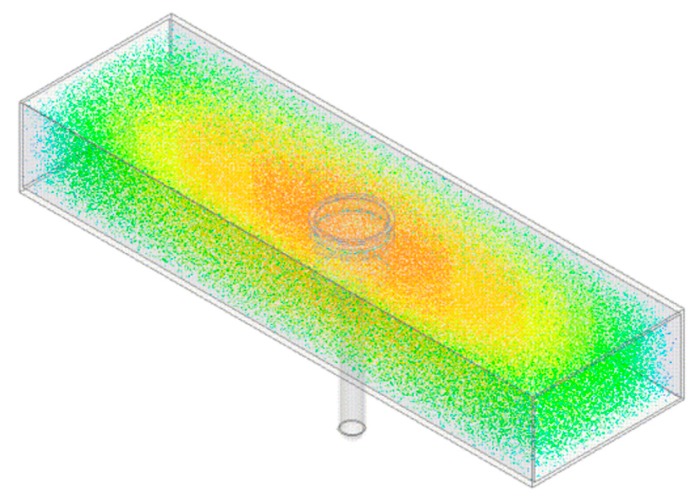
Figure 2.
The resonant cavity model with electric field distribution overlay when resonant at approx. 1.5 GHz, which is where the TE010 mode is present within the cavity according to Equation (1). Notably the electric field is concentrated, as noted by the red/orange coloration, around the EZ-Driploss container which ensures maximum interaction of the EM signal with the target sample.

