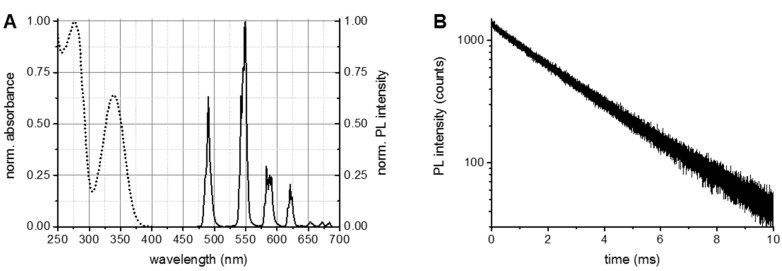
Figure 1.
Optical characterizations of Tb-AB conjugates. (A) Absorption spectrum (dotted line) of the Tb-AB conjugate, of which the Tb peak at 340 nm and the AB peak at 280 nm were used to calculate the Tb per AB labeling ratio. The PL spectrum (solid line) was acquired upon excitation in the Tb absorption band (365 ± 2 nm); (B) Pulsed (Xe flash lamp at 100 Hz) excitation (360 ± 2 nm) was used to measure the PL decay at 490.0 ± 0.5 nm. The slightly bi-exponential decay curve (τ1 = 0.4 ± 0.3 ms, τ2 = 2.70 ± 0.02 ms) gave an amplitude-averaged decay time of τ(Tb) = 2.6 ± 0.2 ms.

