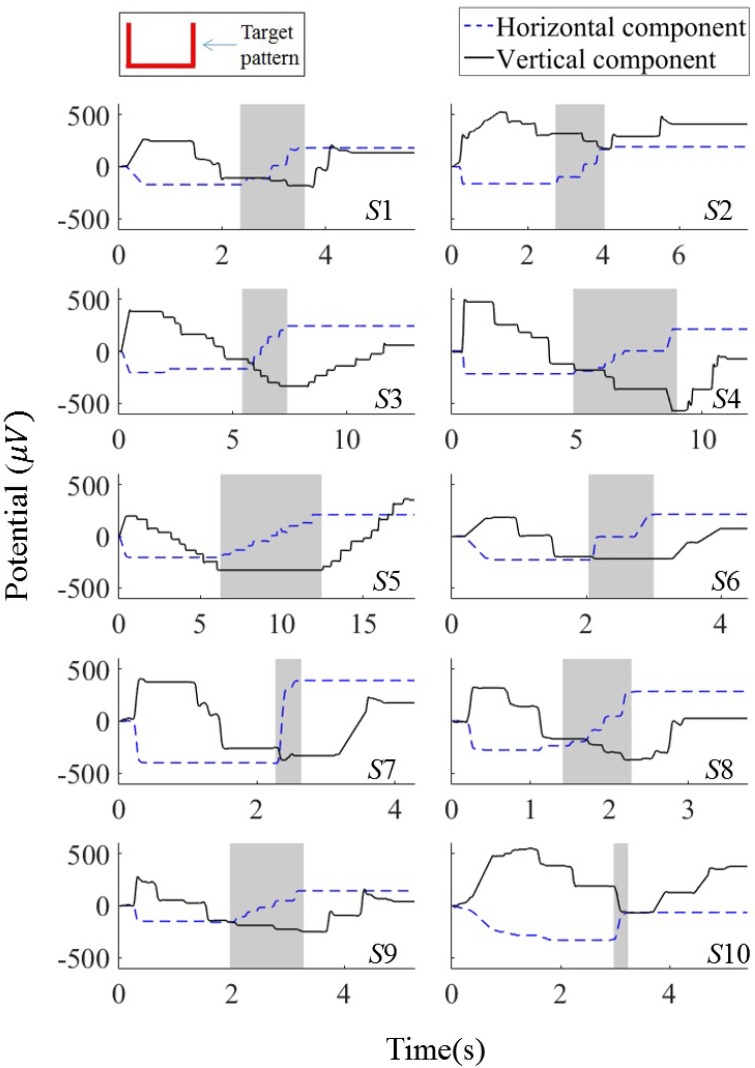
Figure 5.
Horizontal and vertical EOG components for all subjects after saccade detection. The subject identification numbers are indicated at the bottom-right of each plot (from S1 to S10). The shaded regions indicate the time periods in which the subjects moved their gazes in the horizontal direction.

