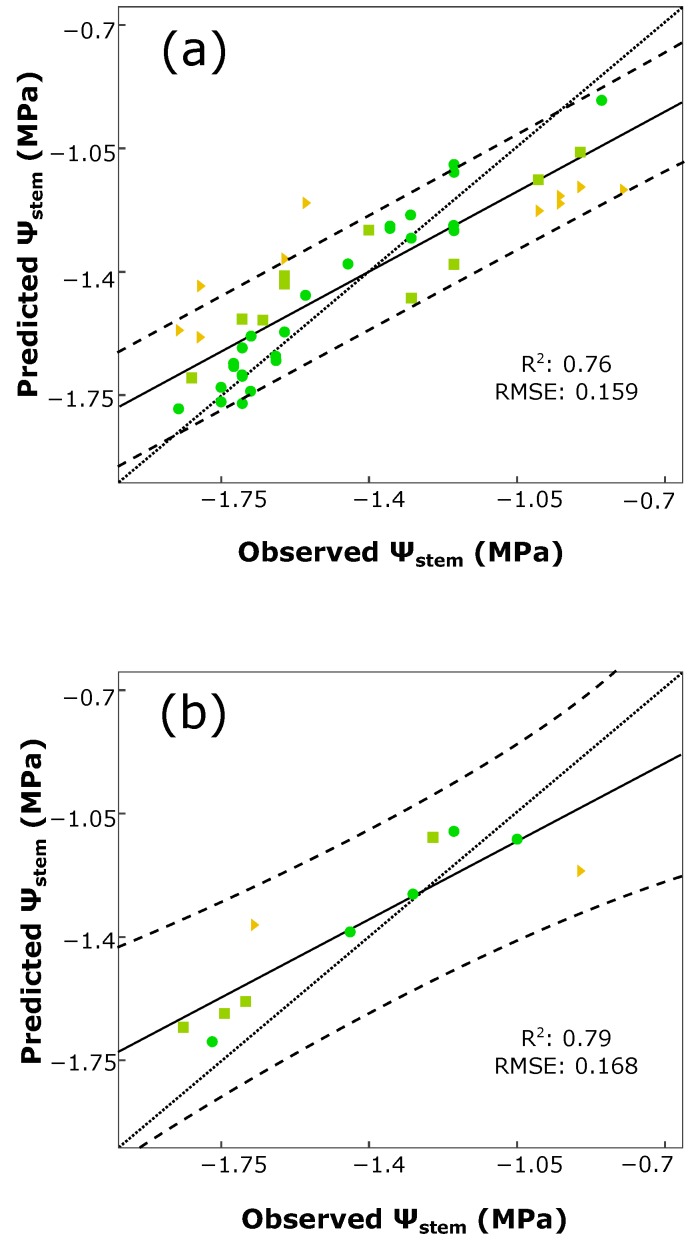
Figure 3.
Regression plot for ψstem estimation of the variety-specific model (Tempranillo) using a Rotation Forest and M5 trees with a 5-fold cross (a) and external (b) validations. Prediction confidence bands are shown at a 95% level (dashed lines). Solid line represents the regression line and dotted line refers to the 1:1 line. Each points’ color and shape refers to its absolute error value |ε| (the absolute value of the difference between the actual value and the predicted one) in MPa: green ●: |ε| < 0.1, minimal error; olive ■: 0.1 ≤ |ε| < 0.2, low error; orange ▼: 0.2 ≤ |ε| < 0.4, moderate error; red ►: |ε| ≥ 0.4, high error.

