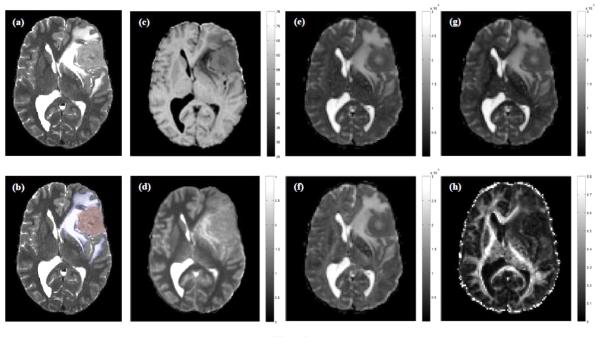
Figure 1.
Maps of (a, b) T2-weighted signal intensity, (c) magnetization transfer ratio (MTR; %), (d) longitudinal relaxation time (T1; s), (e) mean (〈D〉; × 10−6 mm2/s), (f) axial (λAX; × 10−6 mm2/s) and (g) radial (λRAD; × 10−6 mm2/s) diffusivity, and (h) fractional anisotropy (FA) at the level of the lateral ventricles for a 47 year old male patient with a left hemisphere meningioma. Regions of tumor and edema are indicated in red and blue in (b). All images are displayed in radiological convention.

