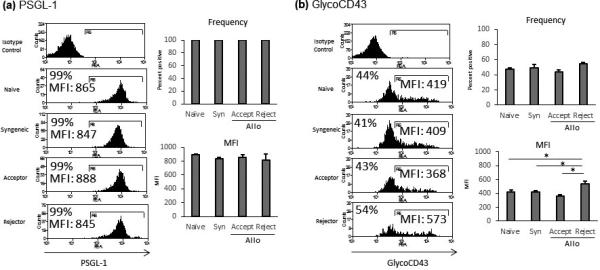
Figure 3. Selectin ligands are highly expressed by Th1 cells from all experimental groups.

Representative flow cytometry histograms showing the frequency and level of expression (Mean Fluorescent Intensity) of selectin ligands by Th1 cells in the draining LNs of naïve, syngeneic transplant recipients (Syn), allogeneic (Allo) transplant acceptors (Accept), and rejectors (Reject). (a) PSGL-1 is expressed by nearly 100% of Th1 cells, with no significant difference in level of expression between groups. (b) GlycoCD43 is expressed by approximately one half of all Th1 cells, irrespective of experimental group. The level of GlycoCD43 expression (MFI) is significantly upregulated in allogeneic rejectors. (Frequencies and MFI shown are of the representative histogram, n = 5 mice/group, with one animal comprising one flow cytometry sample; *p<0.05; data from one experiment of two are shown).
