
Figure 8.
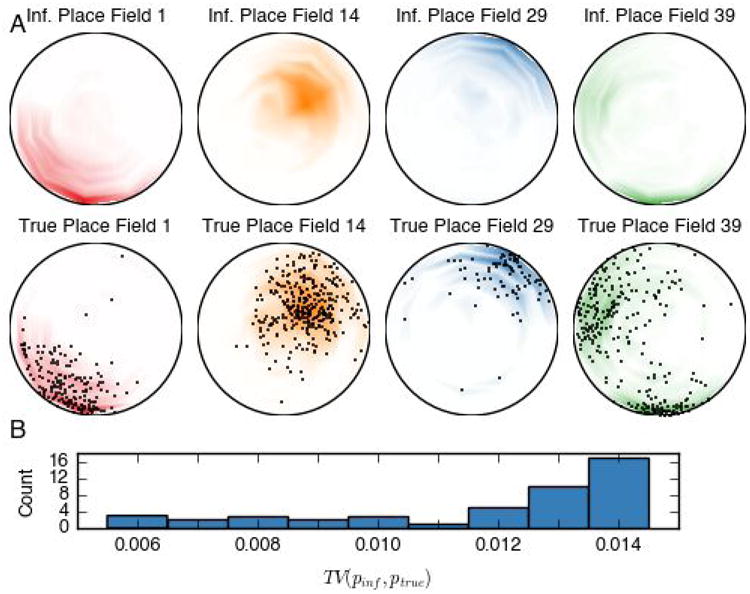
(A) Comparison of inferred and true place fields for four randomly selected hippocampal neurons. The inferred place field (top row) for cell c is a combination of location distributions for each state i weighted by the inferred firing rates λc,i, whereas the true place field (bottom row) for cell c is a histogram of locations in which cell c fires. The black dots show the rat's locations used for each histogram. The inferred place fields closely match the true place fields. With adequate spike data recording, we expect a higher latent state dimensionality to yield higher spatial resolution in the inferred place fields. (B) Summary statistics of total variation (TV) distance between the inferred and true place fields for 47 neurons. The TV distance for the four examples in panel (A) are 0.0123, 0.0067, 0.0136, and 0.0091, respectively.