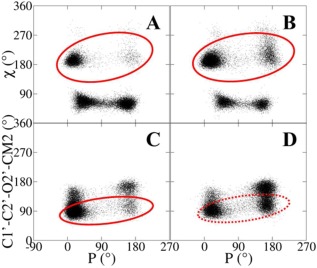
Figure 7.

Correlation between torsions and sugar pucker for nucleosides from the MD simulations, including the χ/P correlation of a) pseudouridine and b) 7‐methylguanosine, and the 2'OMe/P correlation of c) 2′‐O‐methylcytidine and d) 2′‐O‐methylguanosine. The solid red circles in a) and b) show the dominance of north when χ is anti, and similarly dominant north occurs in c) 2′O‐methylpyrimidine when 2'OMe torsion is Base in c), but this correlation is weaker in d) 2′O‐methylpurine. [Color figure can be viewed in the online issue, which is available at wileyonlinelibrary.com.]
